Biology

Molecular experiments, omics analysis, and ecological observations beyond the laboratory.

For interdisciplinary projects, see Computing:C10 / Expression2Translation / PSPNet.

E. coli protein-expression prediction and an MCP design assistant

2026-03 – 2026-05Personal project · Independent development

Bioinformatics

Used public experimental measurements of promoter–RBS (ribosome binding site) combinations to test whether RNA structural information improves predictions for unseen elements, and connected the model to natural-language design tools.

Work and methods: E. coli protein-expression prediction and an MCP design assistant
  • Integrated three public experimental tables and cleaned 11,696 promoter–RBS combinations. Reconstructed RNA sequences around the protein translation-initiation region using measured transcription start sites, computed RNA structural accessibility, and used XGBoost with 12 sequence and structural features to predict relative protein expression (a fluorescence measure).
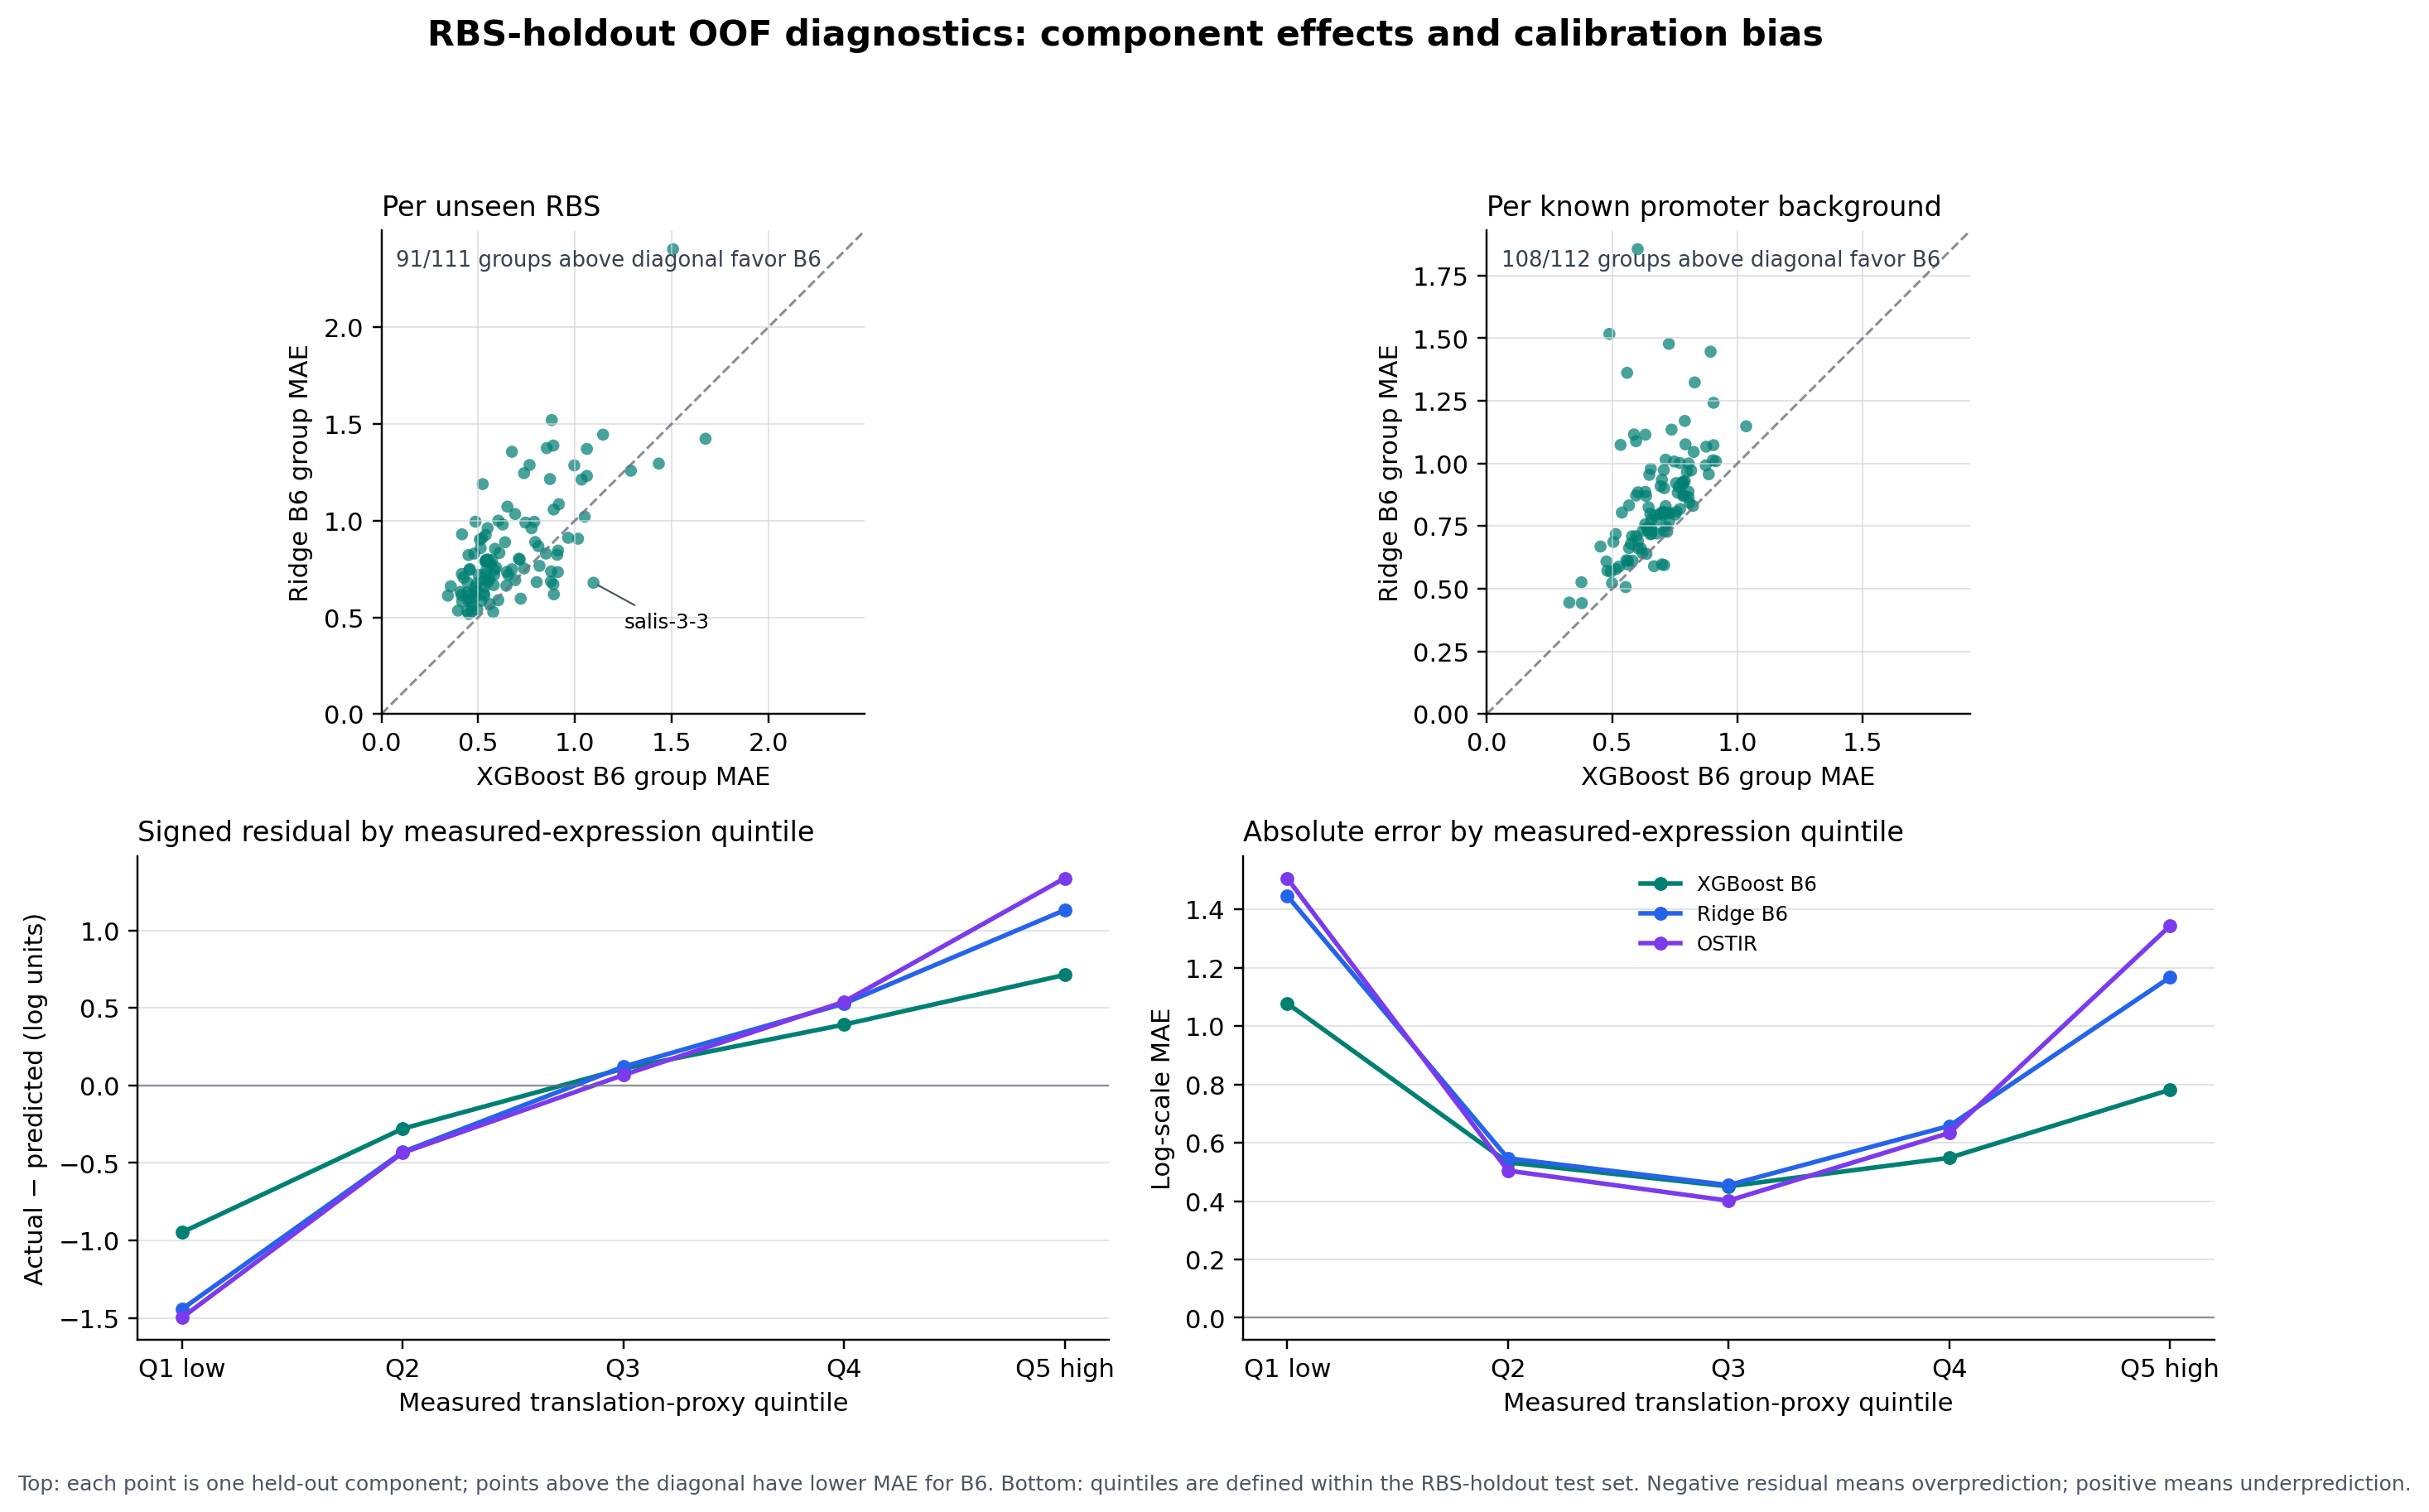
  • To evaluate unseen elements, held out promoters, RBSs, and both together, separating element identities between training and testing. Used five-fold validation, compared with an XGBoost model using nine sequence-only features under the same conditions, and estimated differences with 1,000 grouped bootstrap iterations.
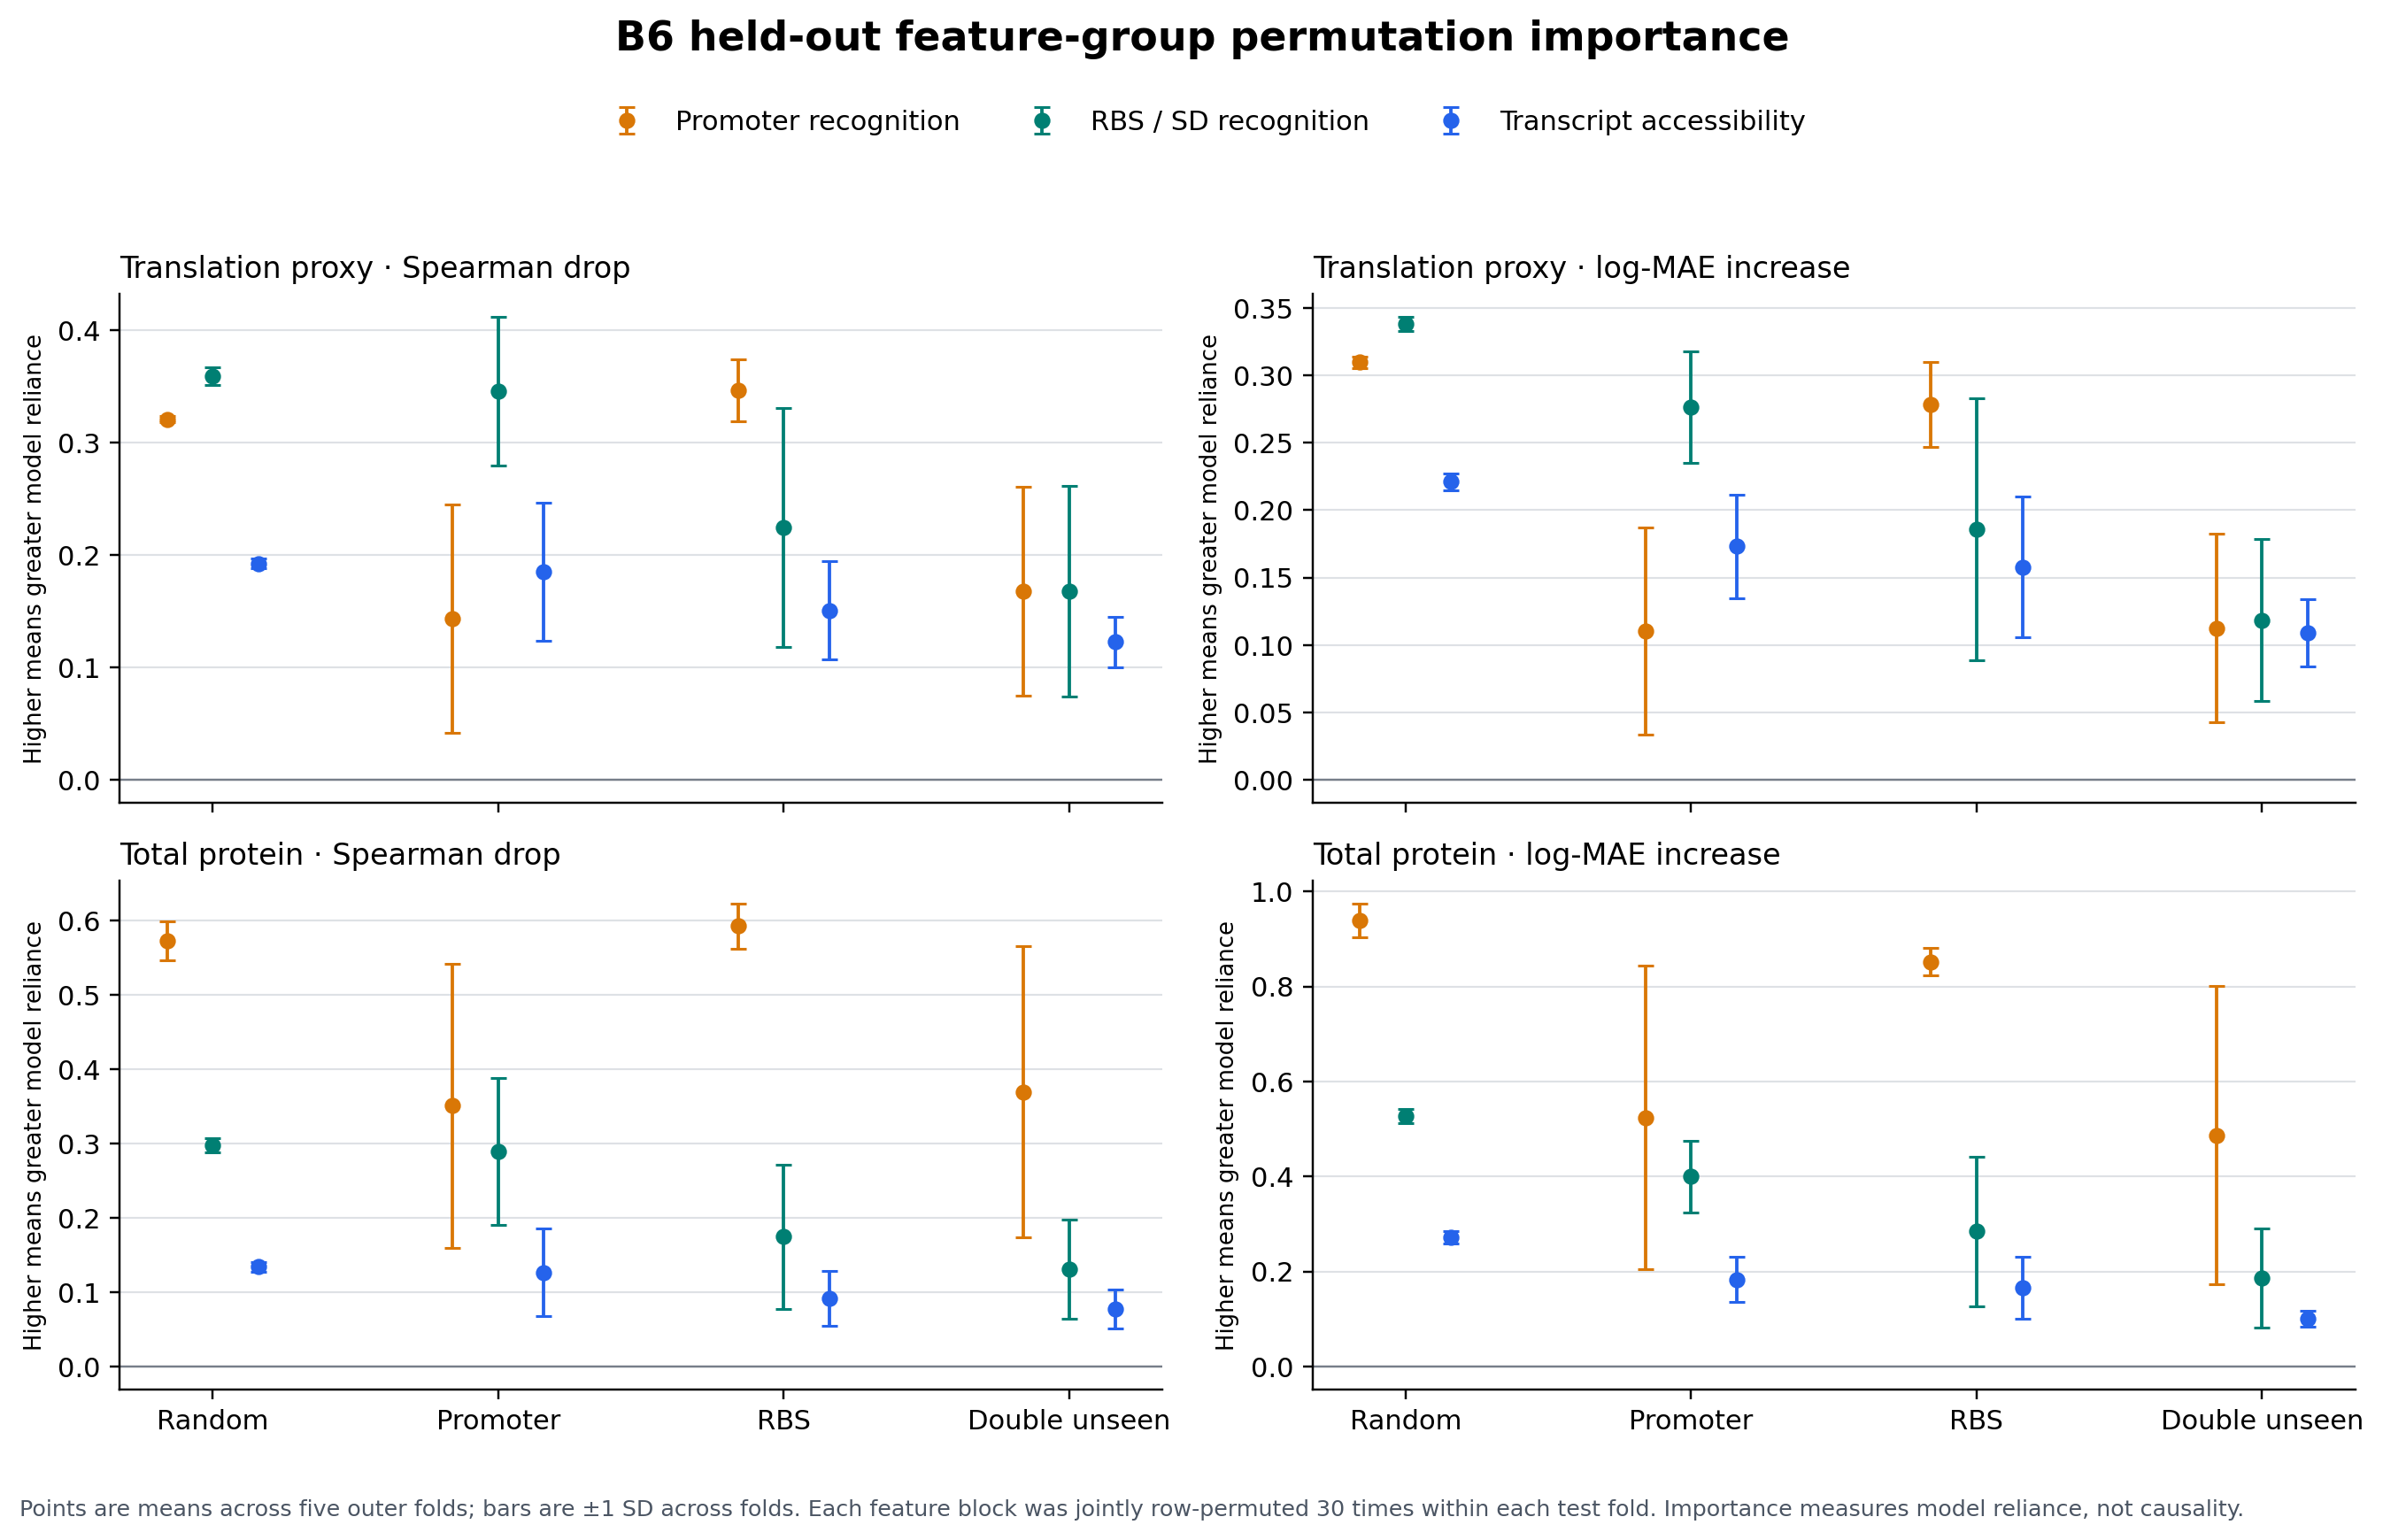
  • Adding structural features reduced log mean absolute error (log-MAE) for the protein/RNA ratio, a translation-related proxy, by approximately 10%–13%. Improvement direction was consistent across four split seeds. These results come from data evaluation in a fixed reporter-protein context.
  • Exposed nine tools for sequence analysis, expression prediction, and ranking through standard MCP interfaces for compatible AI platforms and clients. Given a promoter, ranked the 111 RBSs in the original data library by predicted expression.
  • Designed 67 tests covering biological inputs, numerical calculations, evaluation isolation, and tool interfaces. Checked sequence coordinates, RNA structural energy, training/test element isolation, and prediction and candidate-ranking call chains to provide reproducible regression validation.

Promoter/RBS, TSS, RNA accessibility, ViennaRNA, XGBoost, OSTIR, grouped cross-validation, bootstrap, Python, MCP
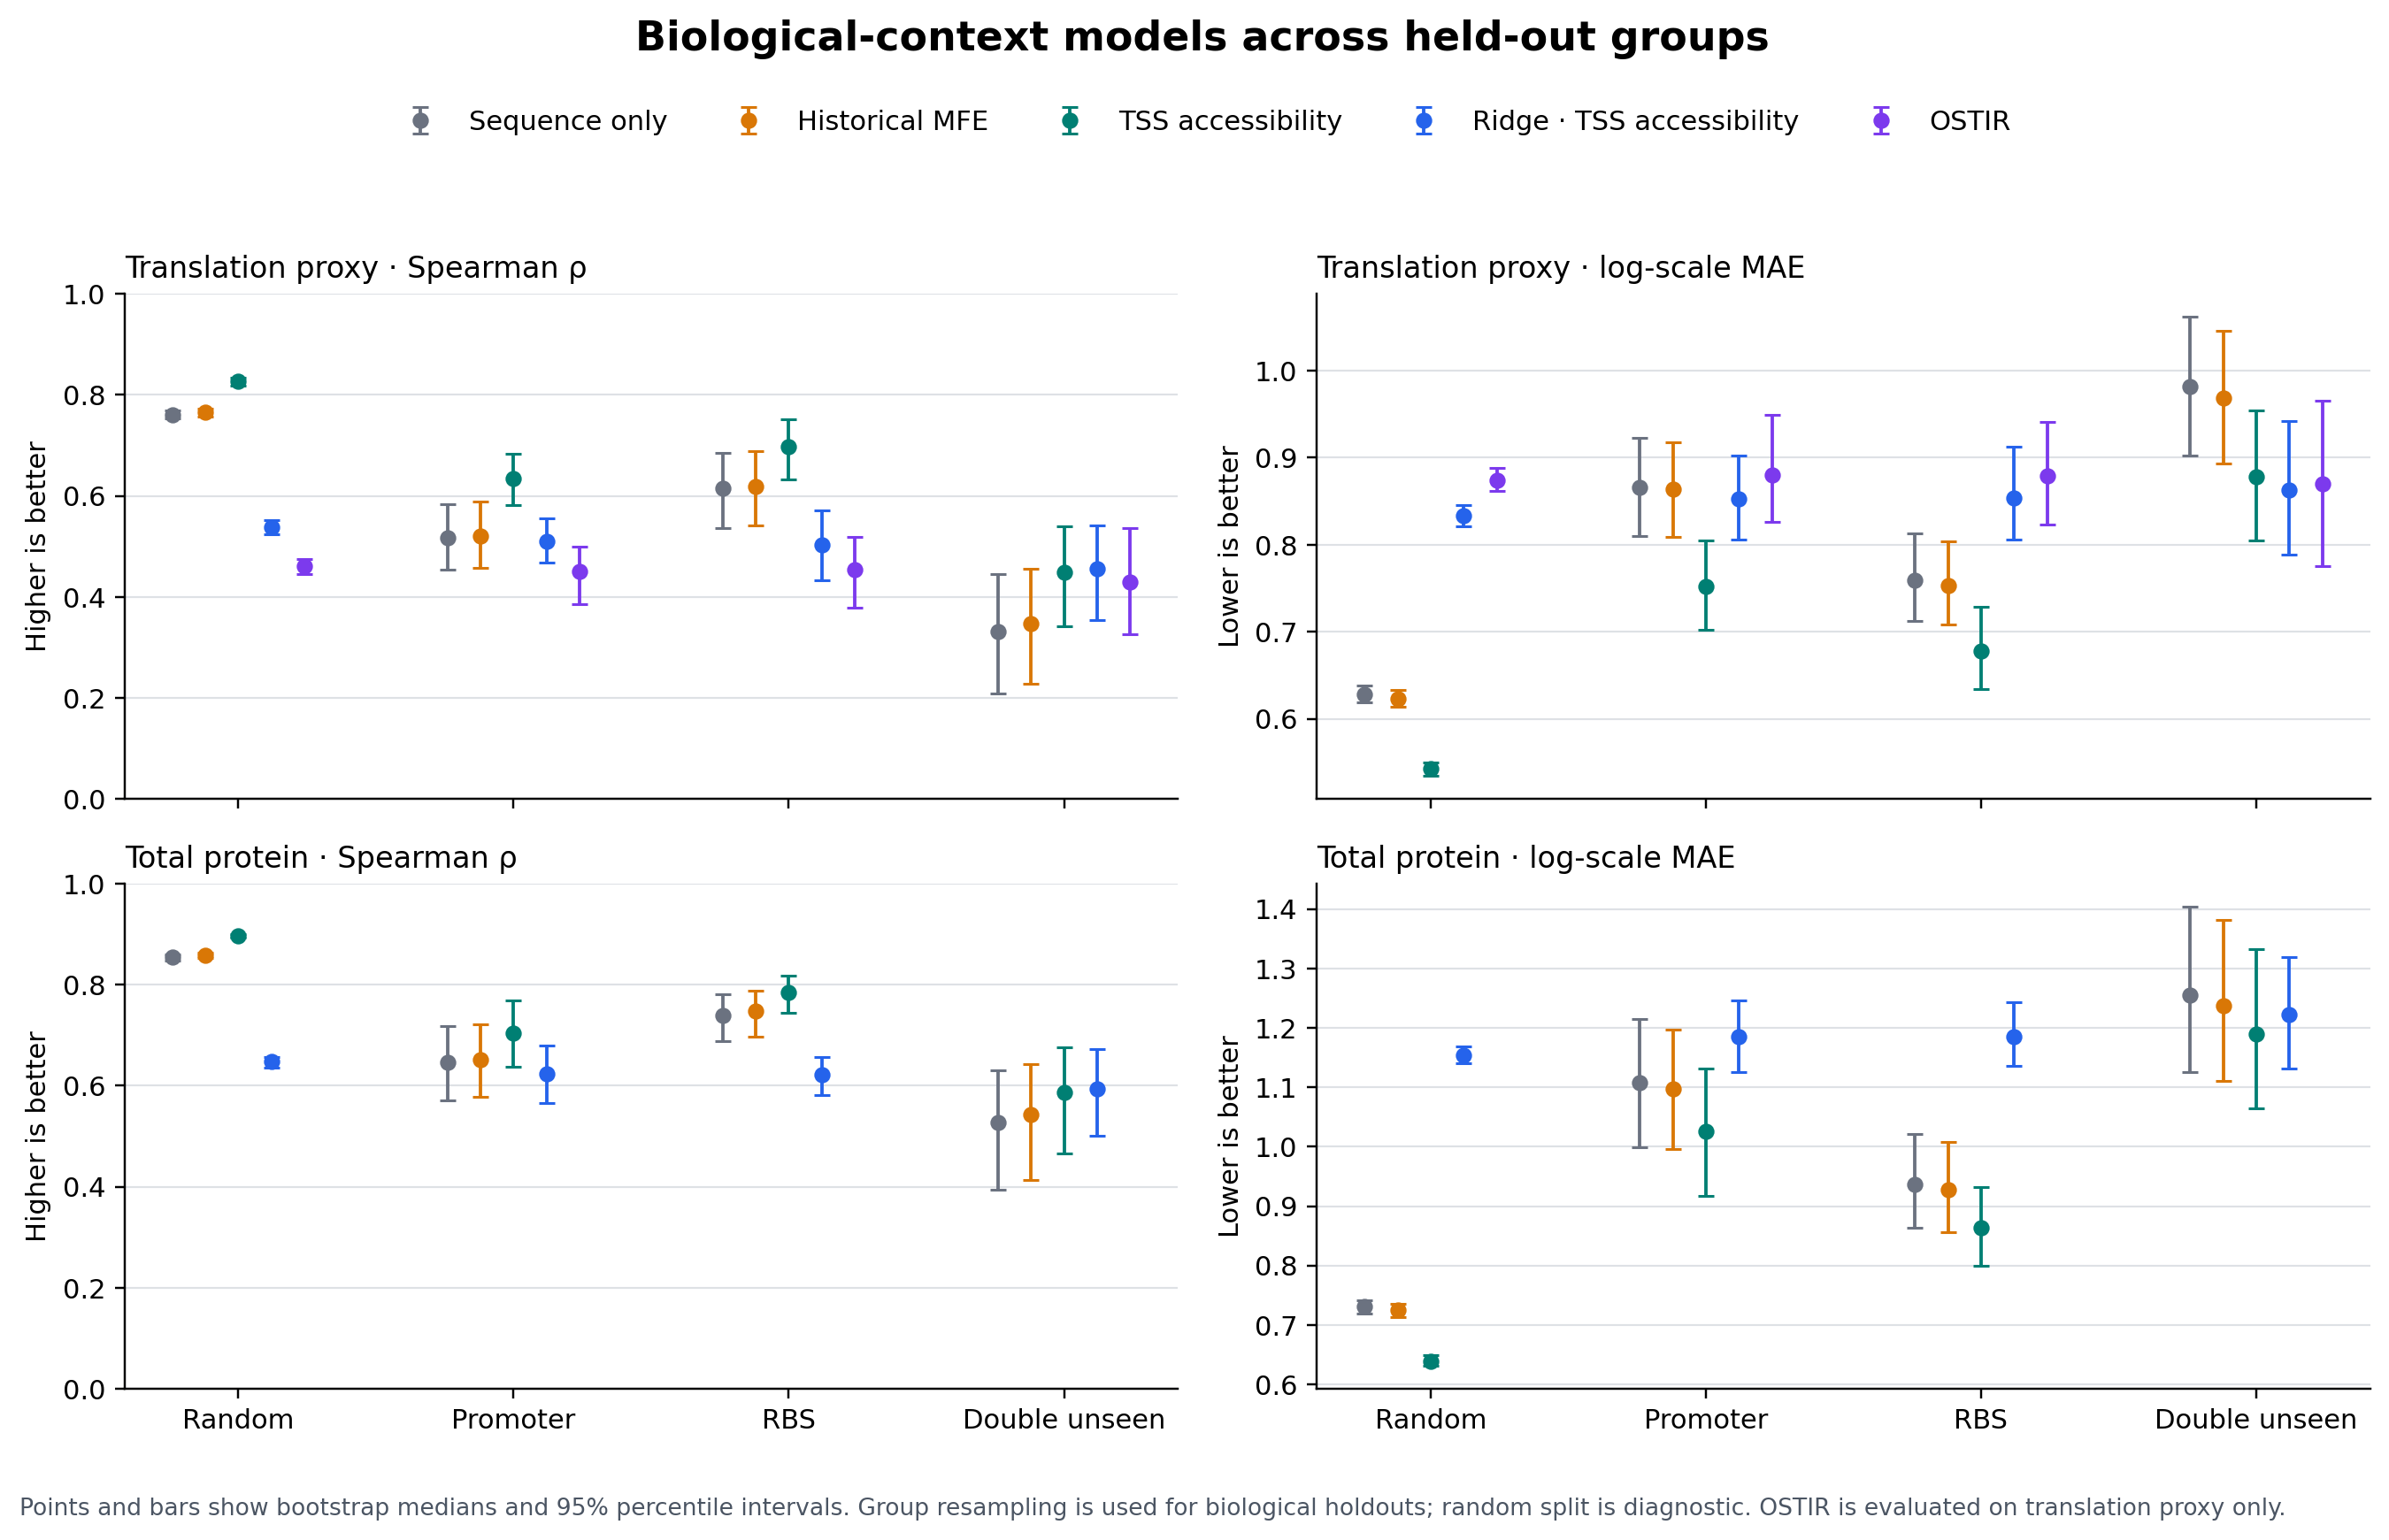
Protein-expression and translation-proxy model comparisons under element holdouts
Model comparisons across four element-holdout scenarios summarize generalization for protein expression and the translation proxy, confidence intervals, and sample sizes.

NSE2/NSE3 of the Smc5/6 complex and genome stability

2024-08 – 2024-12Georgia Tech · Kirill Lobachev Genetics Lab

Wet lab

Using budding yeast as a model, explored how the NSE2/NSE3 subunits of the Smc5/6 complex contribute to repeat-sequence stability, addressing abnormal structures, replication obstacles, and chromosomal rearrangements associated with palindromic DNA.

Work and methods: NSE2/NSE3 of the Smc5/6 complex and genome stability
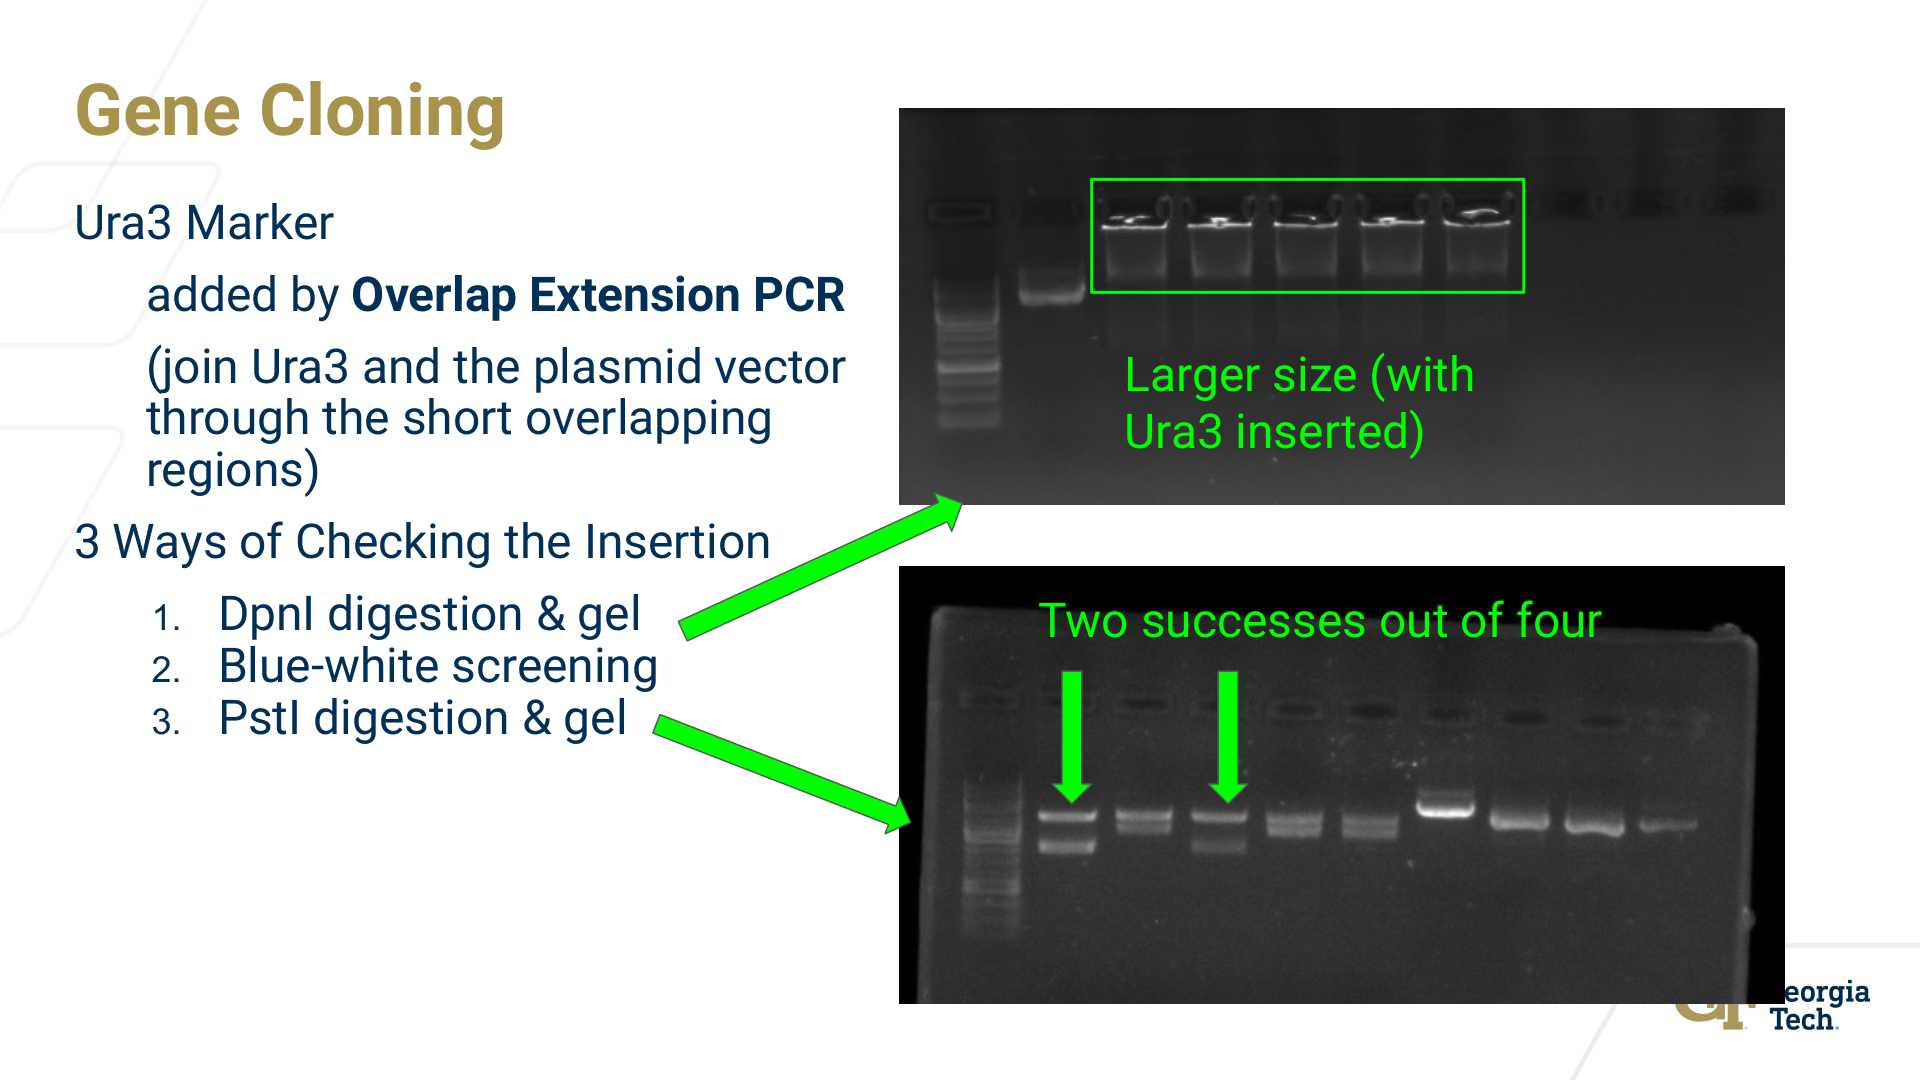
  • Cloning and validation: Participated in foundational NSE2 cloning and the group NSE3 extension, including target-fragment amplification, pRS414 restriction digestion and ligation, E. coli transformation, and initial blue-white screening. Checked constructs using restriction-fragment sizes; the initial NSE3 amplicon was approximately 1,920 bp.
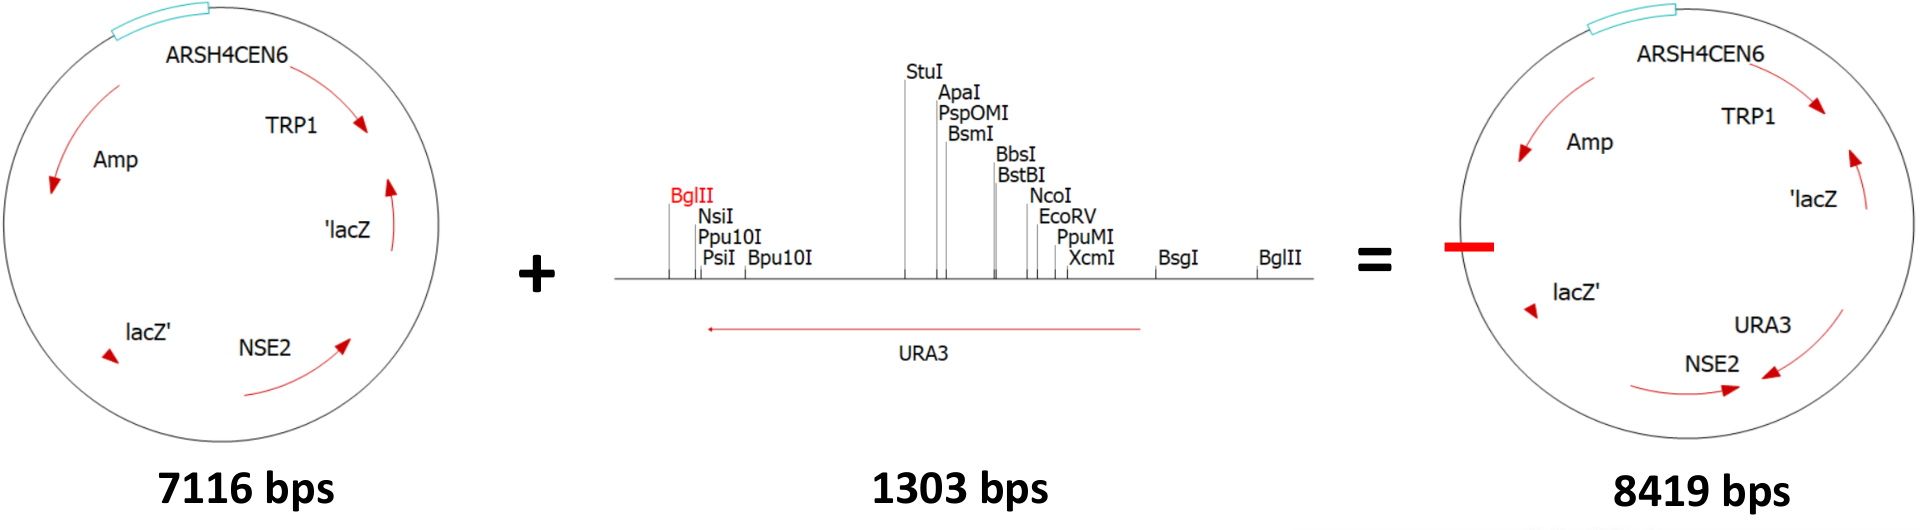
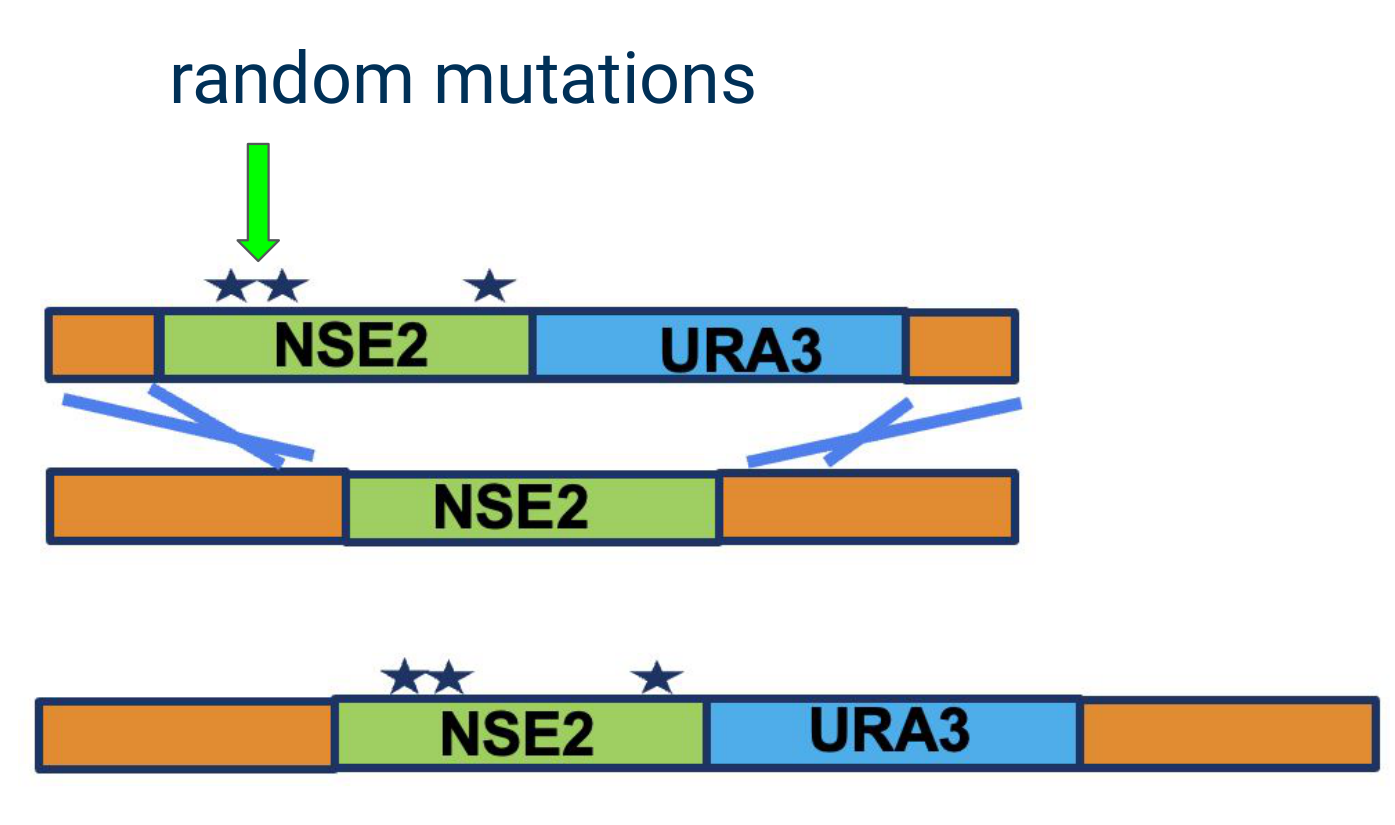
  • Marker insertion and mutagenesis: Inserted URA3 through overlap-extension PCR and used DpnI to remove the parental template. For NSE2 mutagenesis, compared amplification yield and mutagenesis intensity using a manganese-free control and a 160–480 μM MnCl2 gradient.
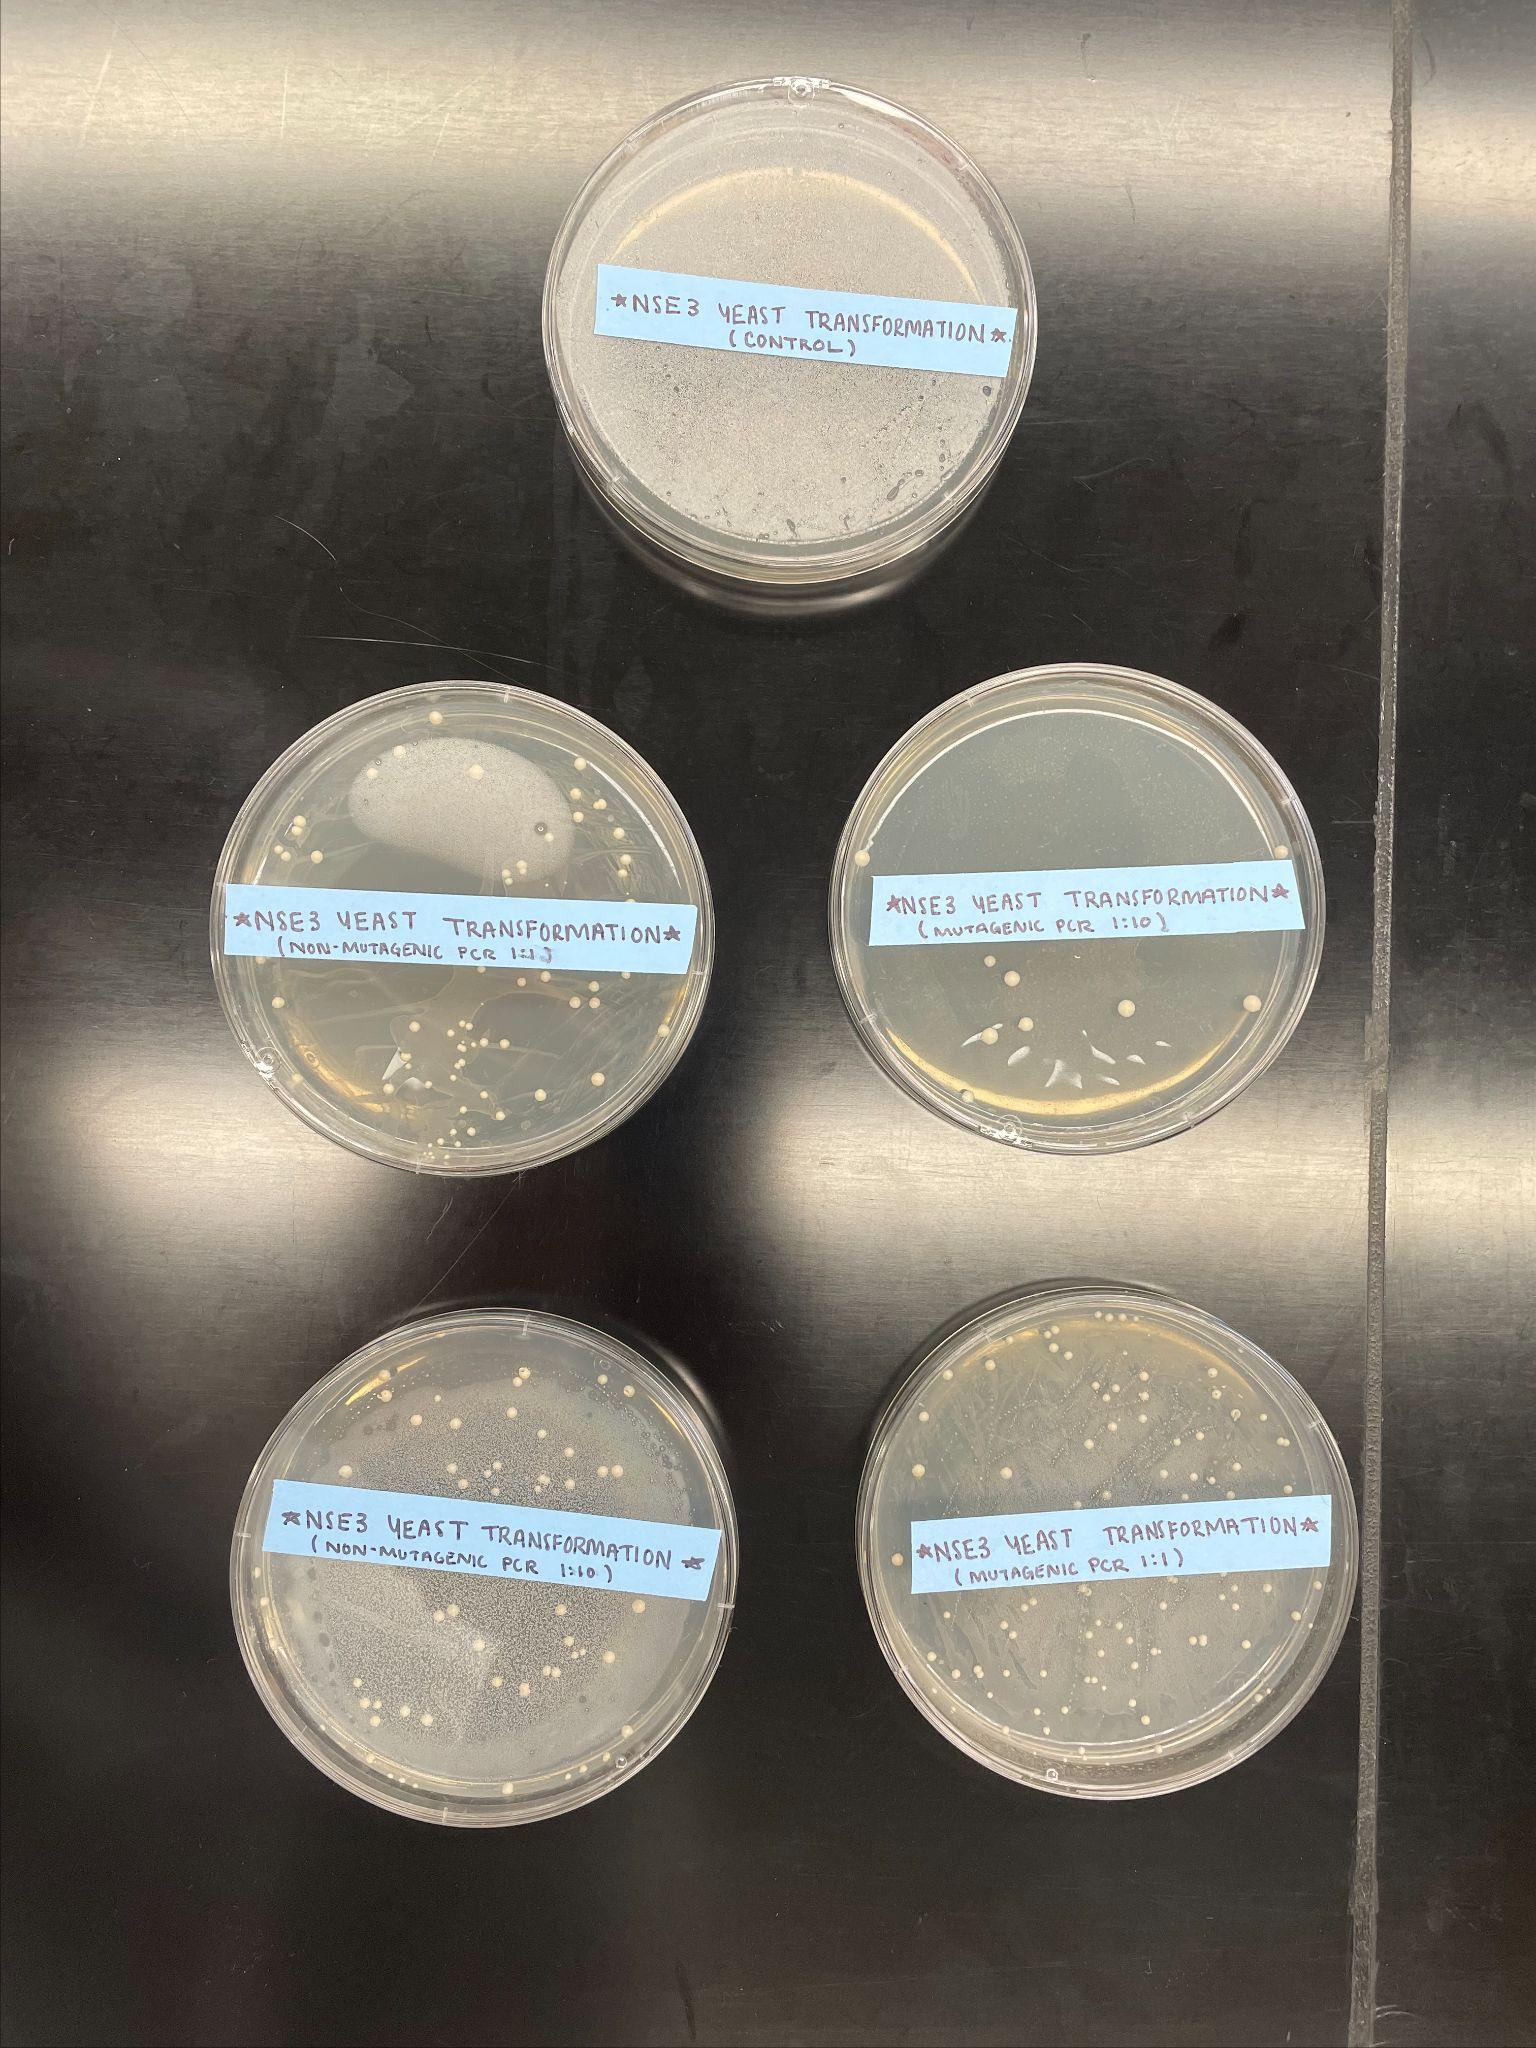
  • Yeast screening: Transformed yeast using PEG/LiAc/single-stranded carrier DNA, with mutagenic, non-mutagenic, and control groups. Observed transformant growth on uracil-deficient medium and 1:10 dilution plates.
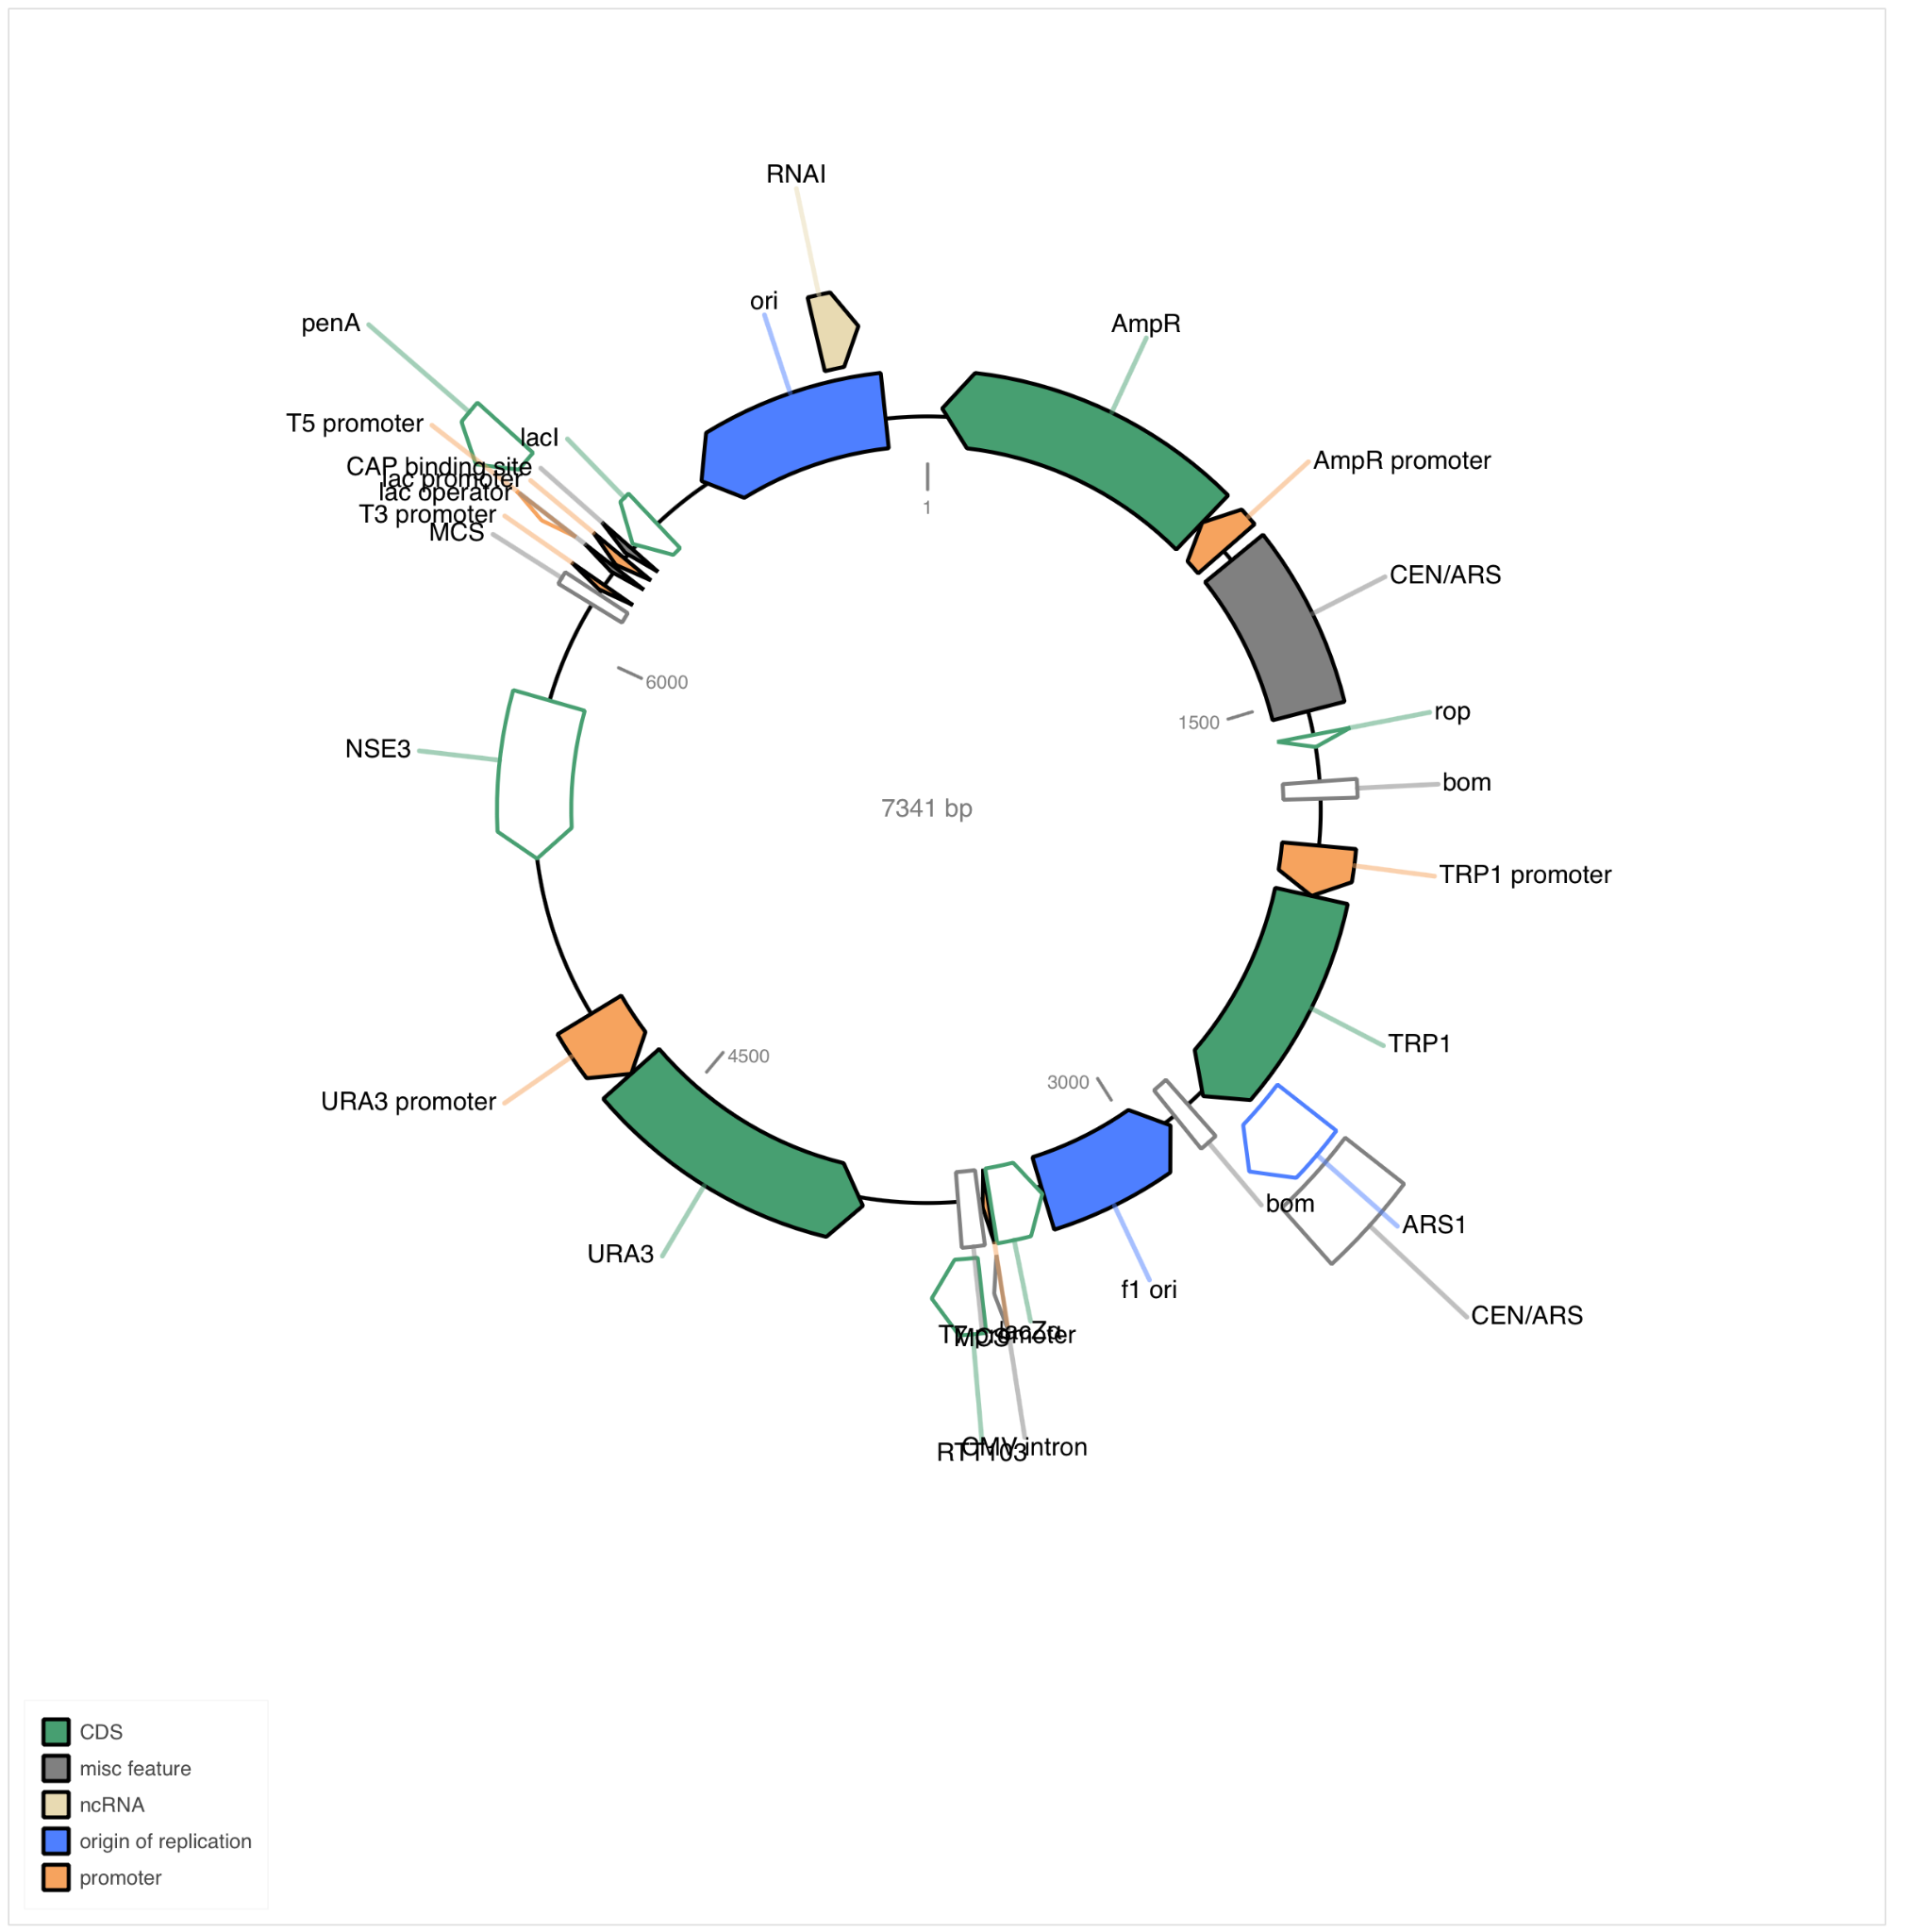
  • Sequencing interpretation: Reviewed NSE3/URA3 constructs using Nanopore clone validation and amplicon reports. The barcode06 assembly measured 7,341 bp, with mean coverage of approximately 1,465× from 1,500 downsampled reads; organized sequence differences alongside construct-quality findings.

Molecular cloning, PCR, restriction digestion and ligation, overlap-extension PCR, mutagenic PCR, yeast transformation, Nanopore

URA3 insertion design: NSE2 plasmid, URA3 fragment, and recombinant plasmid
The URA3 insertion design shows the construction relationships among the NSE2 plasmid, URA3 fragment, and recombinant plasmid, highlighting the insertion site and fragment combination.

Animal facility, Institute of Genetics and Developmental Biology, Chinese Academy of Sciences

2024-05 – 2024-06Laboratory assistant · Beijing

Wet lab

Participated in antigen immunization and antiserum preparation, connecting animal-condition observation, blood-sample processing, and titer testing to support subsequent antibody-material use.

Work and methods: Animal facility, Institute of Genetics and Developmental Biology, Chinese Academy of Sciences
  • Immunization and observation: Emulsified supplied antigens with Freund’s adjuvant for immunization, tracked animal condition across multiple rounds, and promptly recorded and reported abnormalities.
  • Samples and testing: Participated in blood collection and centrifugation to separate serum. Prepared samples for ELISA titer testing to support immunization assessment and subsequent delivery.

Antigen emulsification, laboratory-animal observation, blood-sample processing, serum separation, ELISA

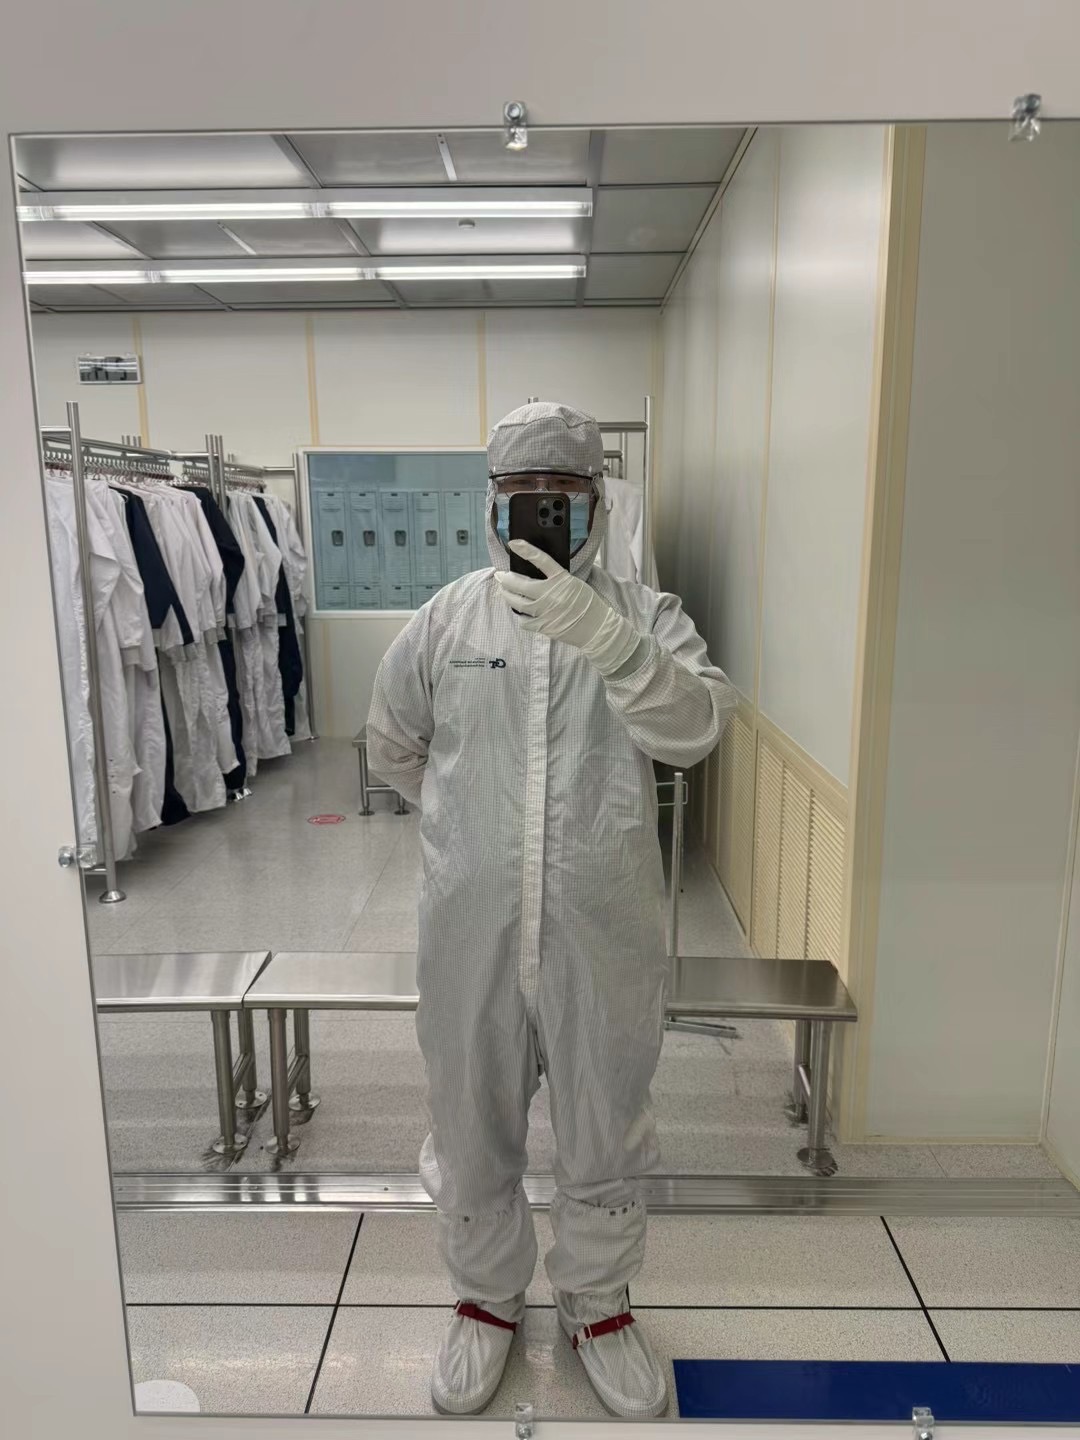
Animal laboratory assistant’s work environment and protective clothing
Animal laboratory assistant’s work environment and protective clothing.

Campus biodiversity monitoring and assessment

2024-01 – 2024-02Georgia Tech · Ecological survey project

Ecological surveysData visualization

Combined field observations and historical records to analyze species composition and spatial distribution in campus green spaces and the Eco-commons building complex.

Work and methods: Campus biodiversity monitoring and assessment
  • Ecological data analysis: Recorded vertebrate observations with an emphasis on birds. Compared species richness with historical data and plotted relative plant and animal abundance to describe community composition.
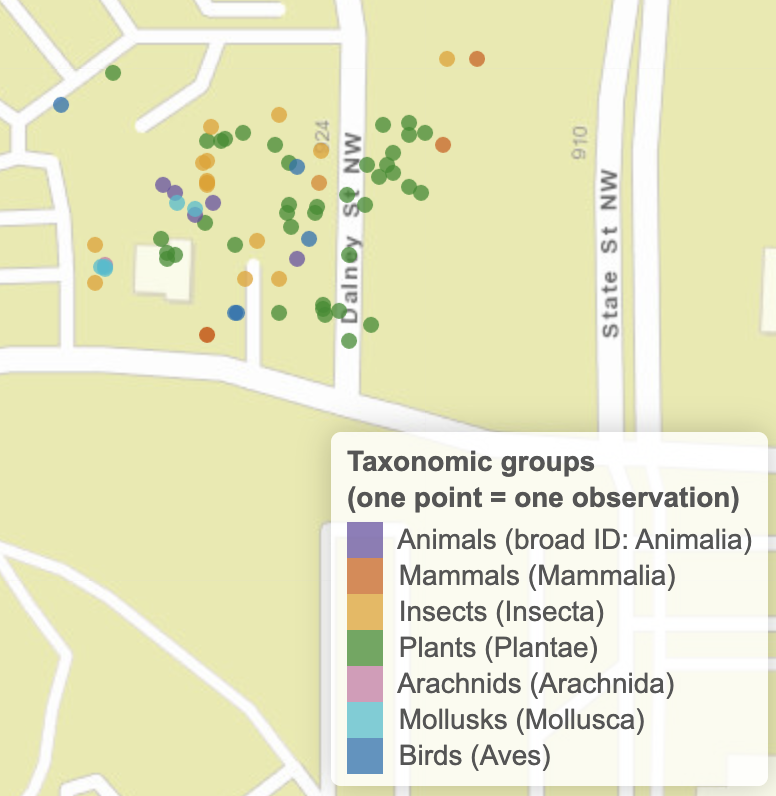
  • Spatial presentation: Mapped observation locations onto a campus map using R leaflet, color-coding species distributions to connect statistical findings with their spatial context.

R, leaflet, species richness, relative abundance, spatial visualization

Campus biodiversity observation-point map and taxonomic-group legend
A map of campus observation points uses color to distinguish birds, mammals, insects, plants, and other taxonomic groups, showing the spatial distribution of survey records.

Black stork population and habitat survey in suburban Beijing

2023-07 – 2023-07Beijing Forestry University research project · Volunteer

Ecological surveys

Recorded summer population observations, distribution, and habitat threats to provide baseline data for regional bird surveys and conservation records.

Work and methods: Black stork population and habitat survey in suburban Beijing
  • Field survey: Participated in black stork population, distribution, and habitat surveys in suburban Beijing, recording potential threats and organizing observations.
  • Data reporting: Reported survey data to the Beijing Municipal Forestry and Parks Bureau to support broader local bird-data compilation.

Field observation, species distribution, habitat survey, data reporting

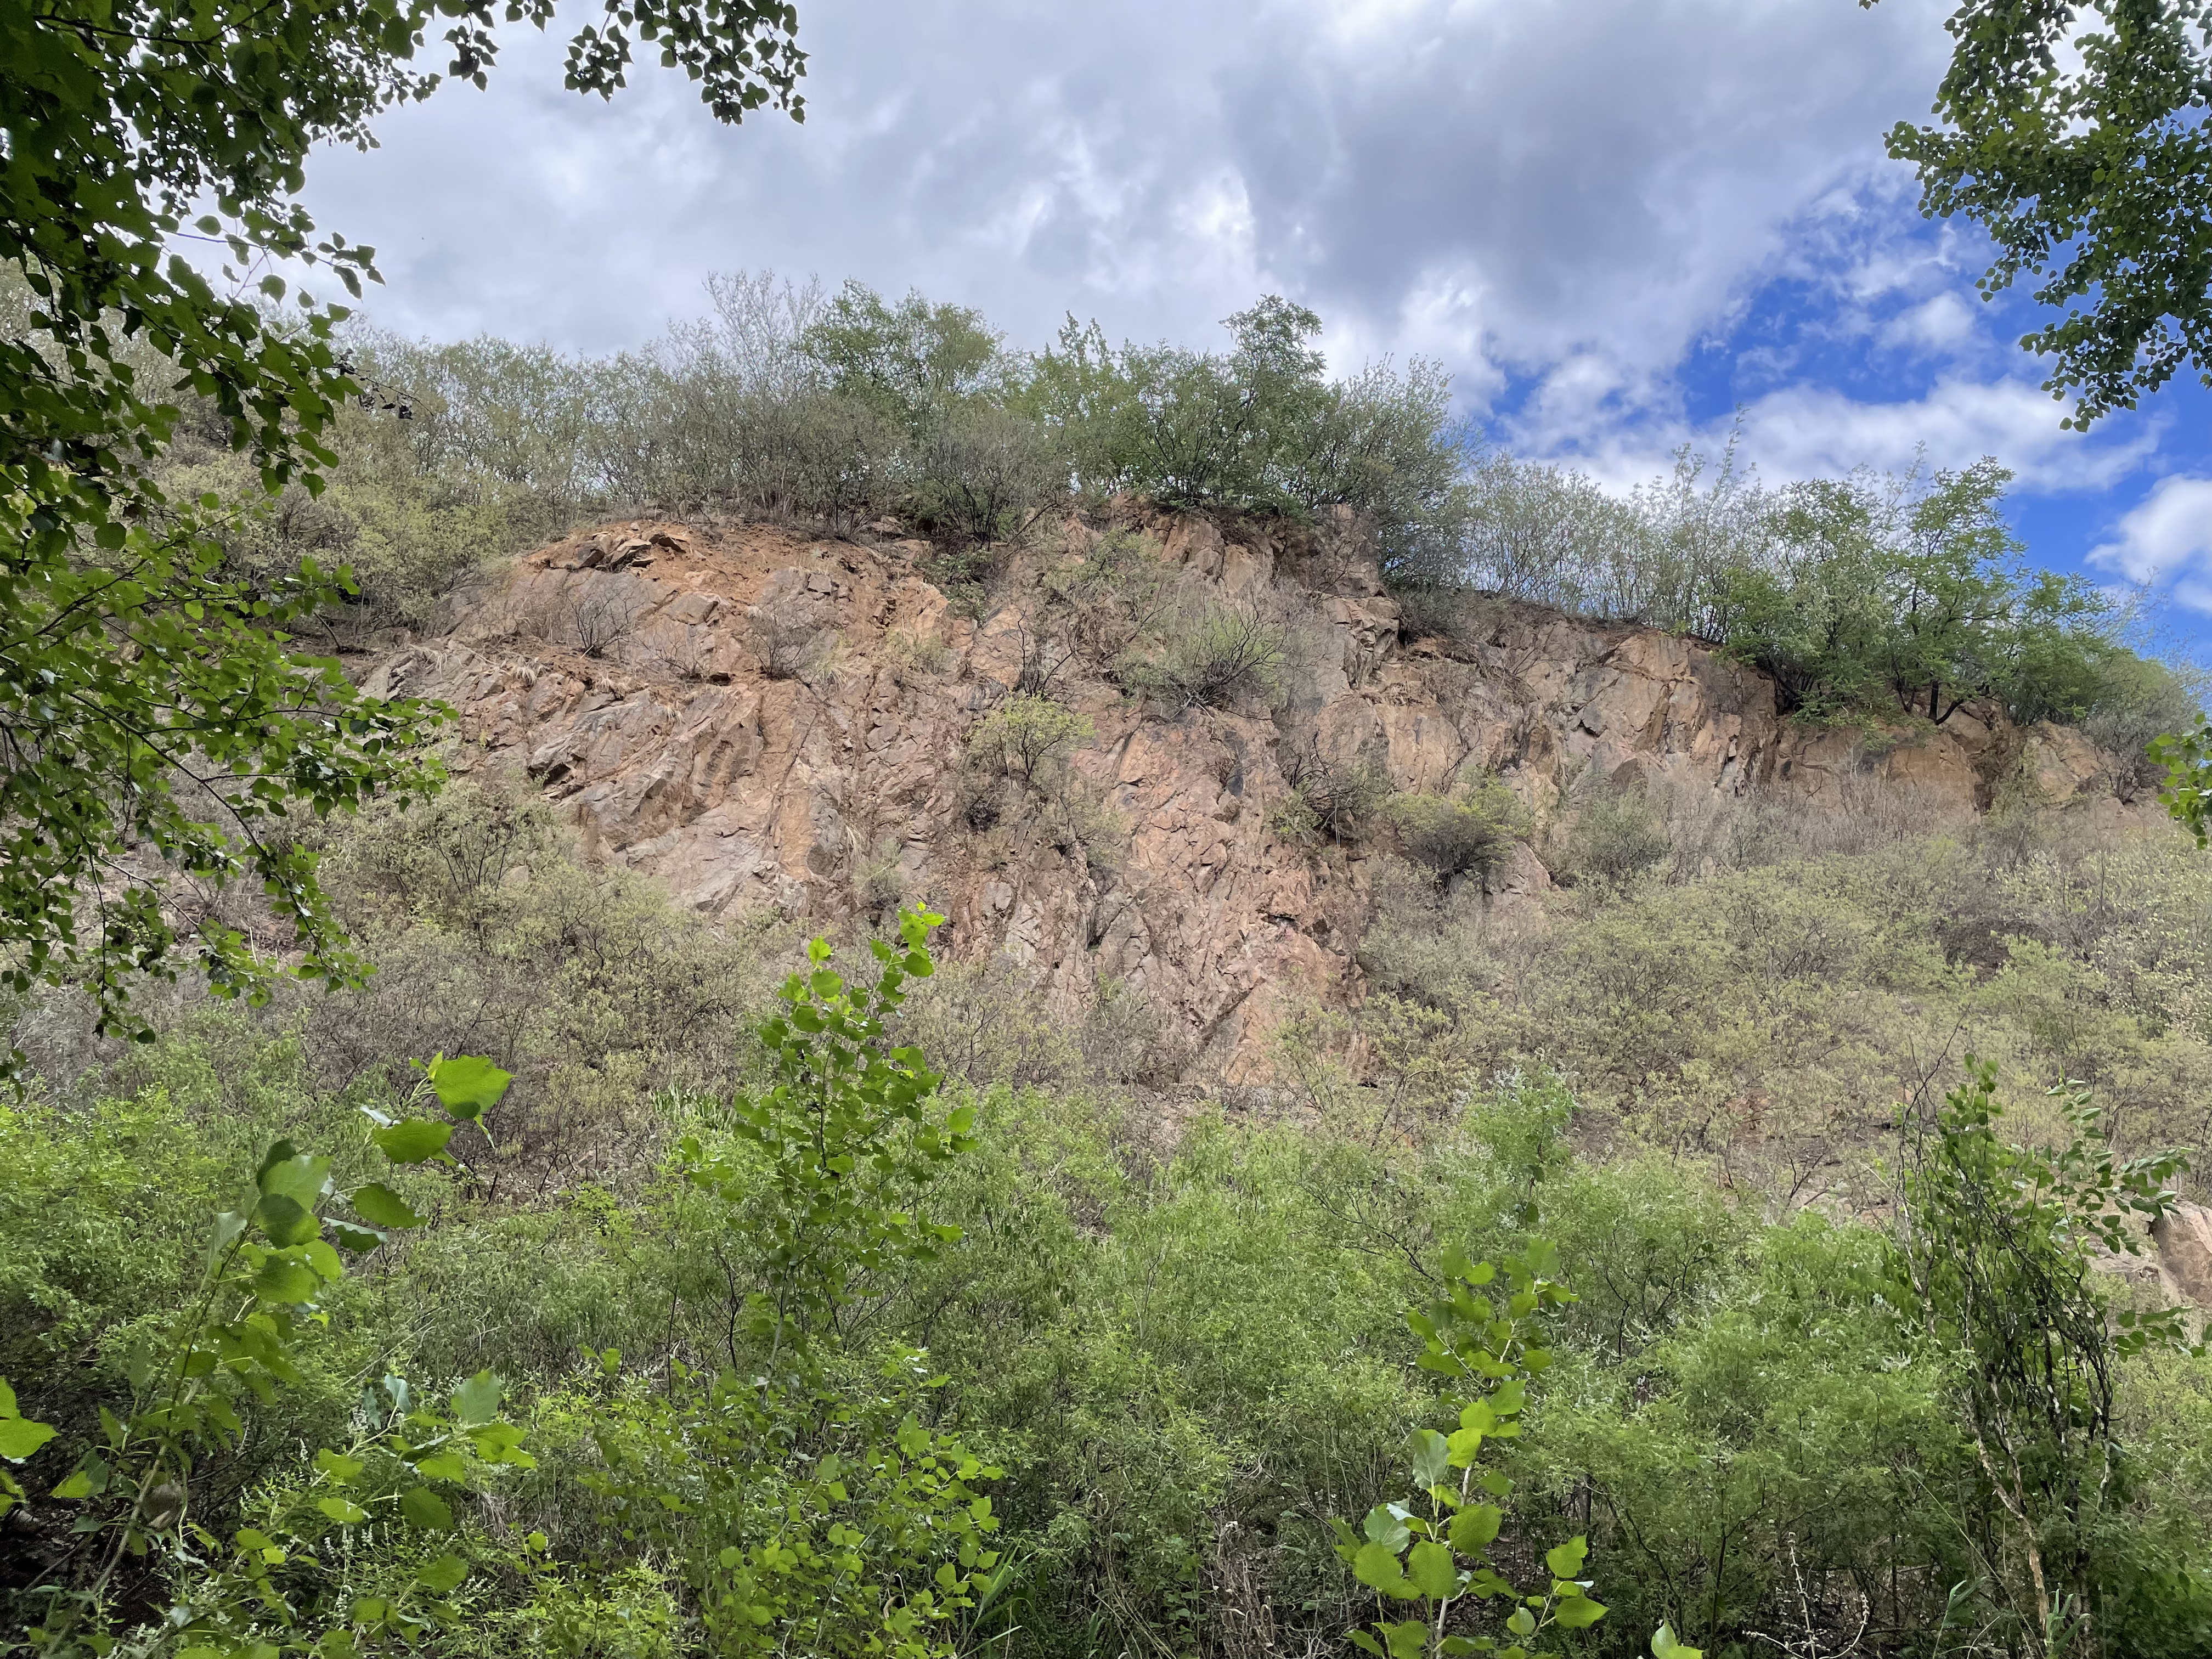
Cliff and surrounding vegetation in the suburban Beijing black stork survey
Cliff habitat from the suburban Beijing black stork survey, showing the spatial structure of rock faces, shrubs, and surrounding vegetation.

RNA-seq reanalysis of ovarian cancer cell responses to interventions

2022-09 – 2022-11Georgia Tech · Individual project in a student bioinformatics club

BioinformaticsData visualization

Used RNA-seq to examine ovarian cancer cell responses to antitumor interventions, identifying gene-expression and pathway changes as clues to intervention mechanisms.

Work and methods: RNA-seq reanalysis of ovarian cancer cell responses to interventions
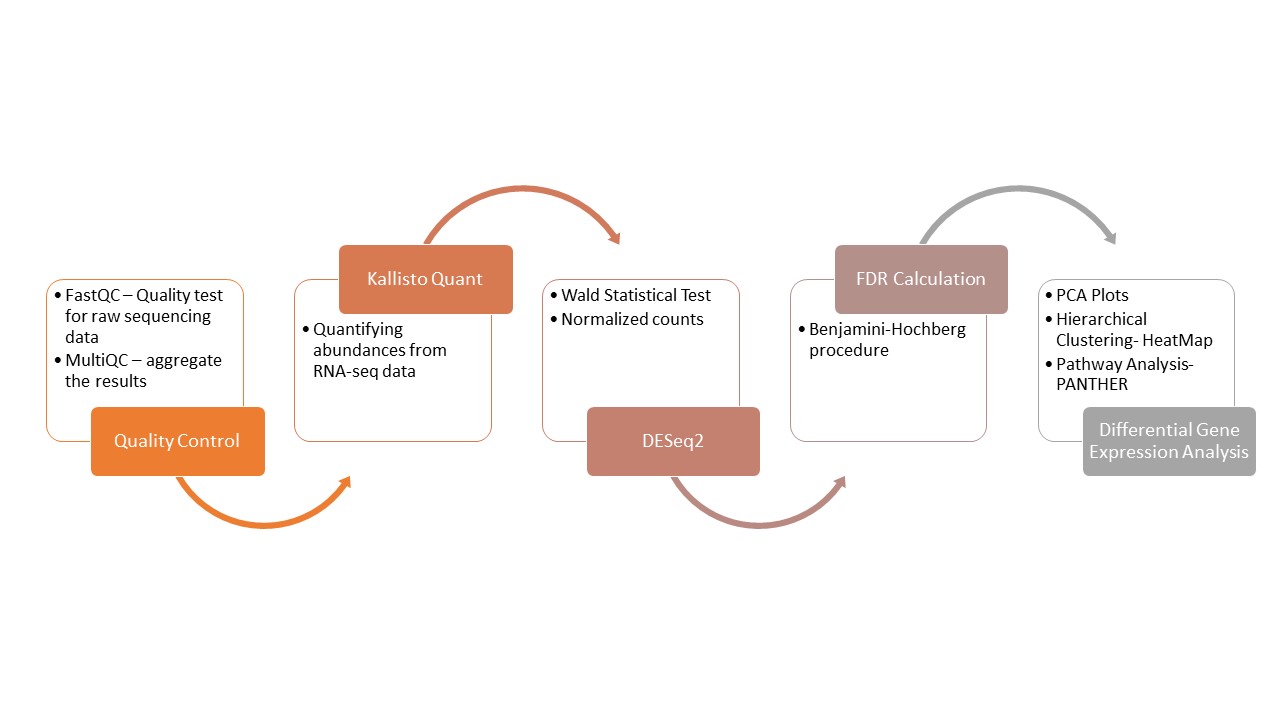
  • Data and QC: Selected GSE212598 and GSE203044 from GEO, totaling 12 RNA-seq samples, with three treated and three control samples per dataset. Used FastQC/MultiQC for quality checks and Kallisto for transcript quantification.
  • Differential analysis: Applied the DESeq2 Wald test and BH/FDR to approximately 30,800 and 24,600 expression features. Using the existing adjusted p-value < 0.05 threshold, identified 11,675 and five features, respectively.
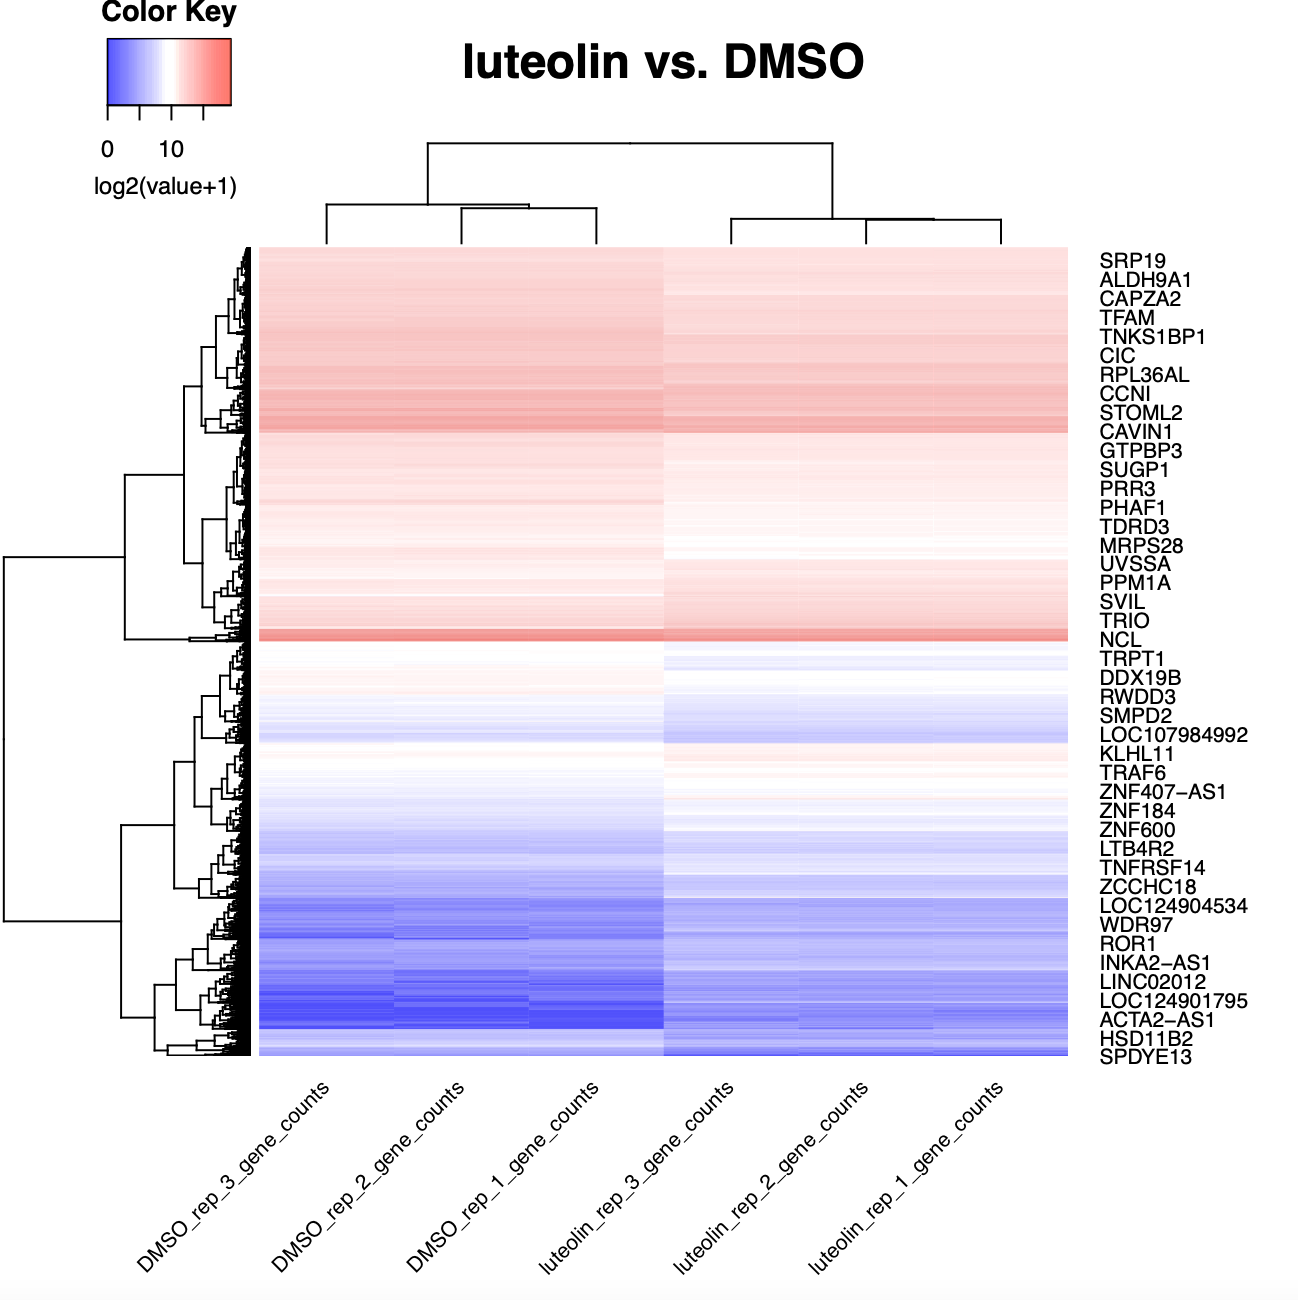
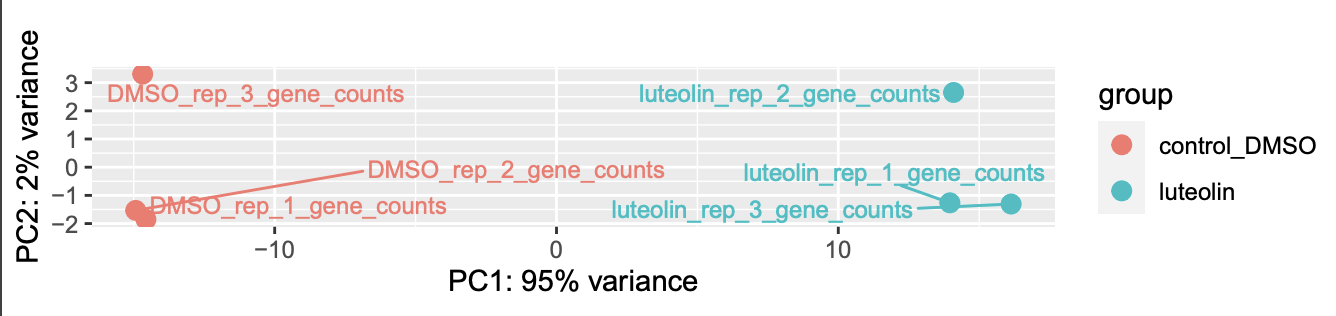
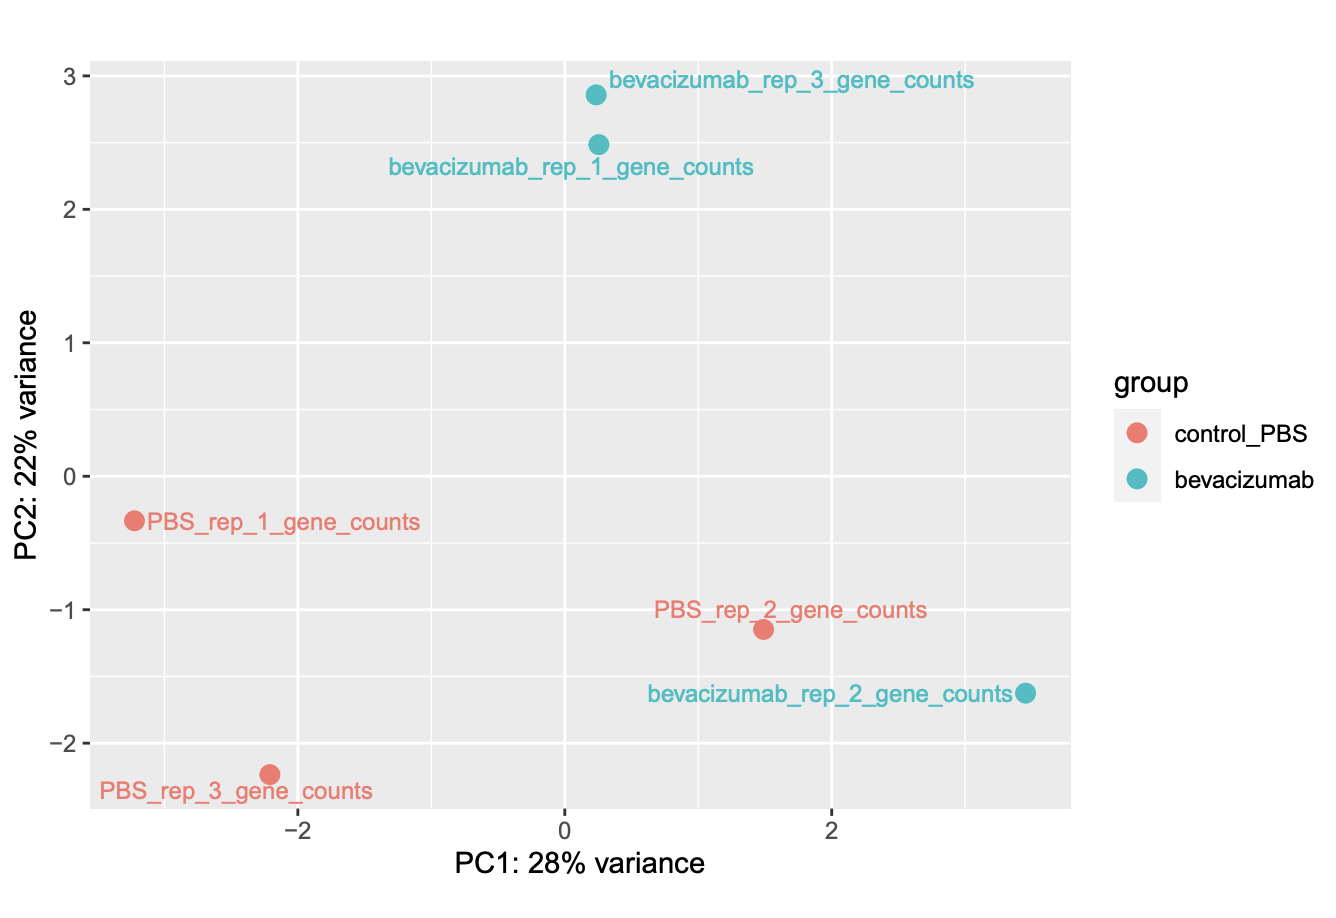
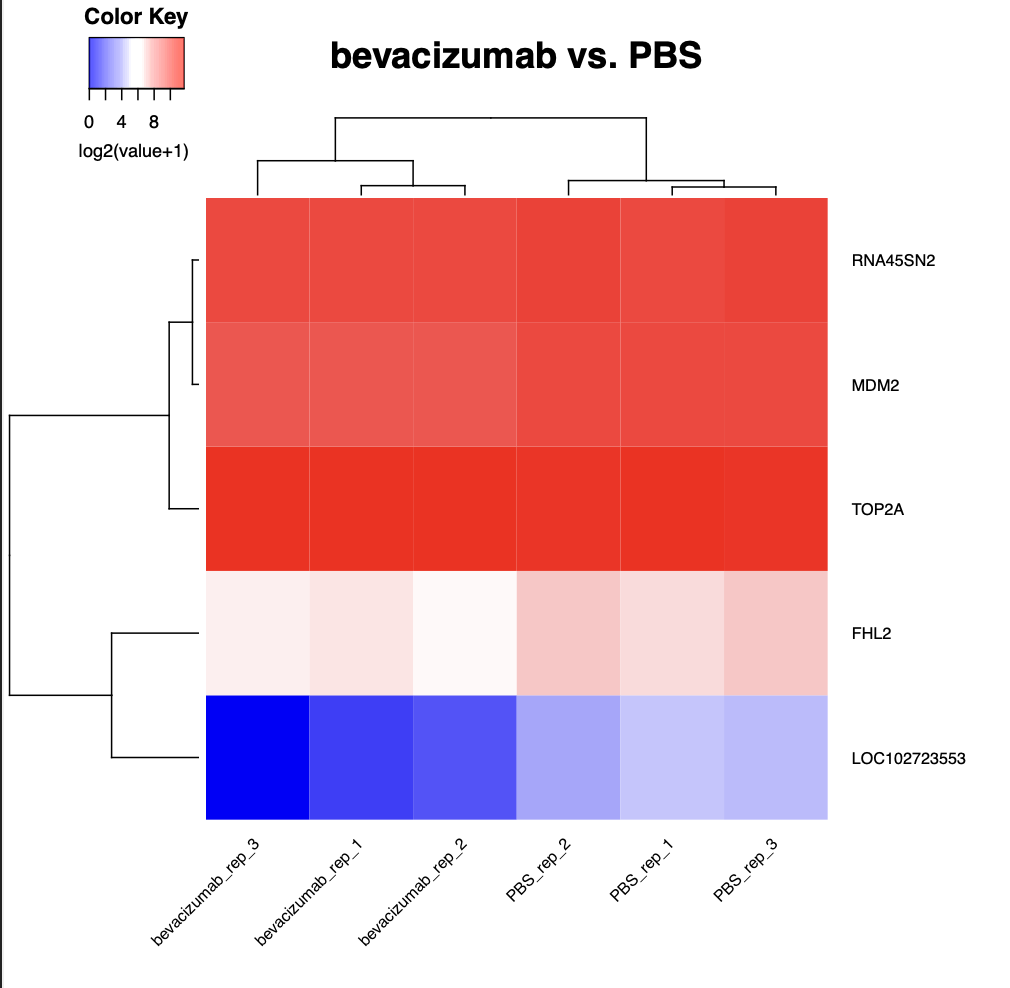
  • Biological interpretation: Combined PCA, hierarchical clustering, and PANTHER/Reactome analyses of cell stress, cell cycle, and endoplasmic-reticulum stress responses. Connected expression separation in the luteolin data with pathway clues while distinguishing within-cohort conclusions from cross-cell-line comparisons.

RNA-seq, FastQC, MultiQC, Kallisto, DESeq2, R, BH/FDR, PCA, PANTHER, Reactome

A2780 expression clustering heatmap: Six luteolin and DMSO samples
The expression heatmap for luteolin- and DMSO-treated A2780 cells shows expression patterns, the color scale, and hierarchical clustering across six samples.

Human exome analysis and OR4F5 variant interpretation

2022-09 – 2022-11Personal project

Bioinformatics

Combined VEP example annotations with structural models to interpret candidate missense variants and their potential effects on protein function, providing clues for subsequent functional validation.

Work and methods: Human exome analysis and OR4F5 variant interpretation
  • Pipeline practice: Documented a BWA-MEM → SAMtools → BCFtools → VEP workflow for public SRR077862 data, covering GRCh38 reference selection, attempted read alignment, alignment processing, and a variant-screening plan.
  • Annotation and interpretation: Organized variant consequences from example VEP output, selected the OR4F5 K104Q missense change, and consulted dbSNP/UniProt and related literature. Combined amino-acid changes, population frequency, and functional predictions in the interpretation.
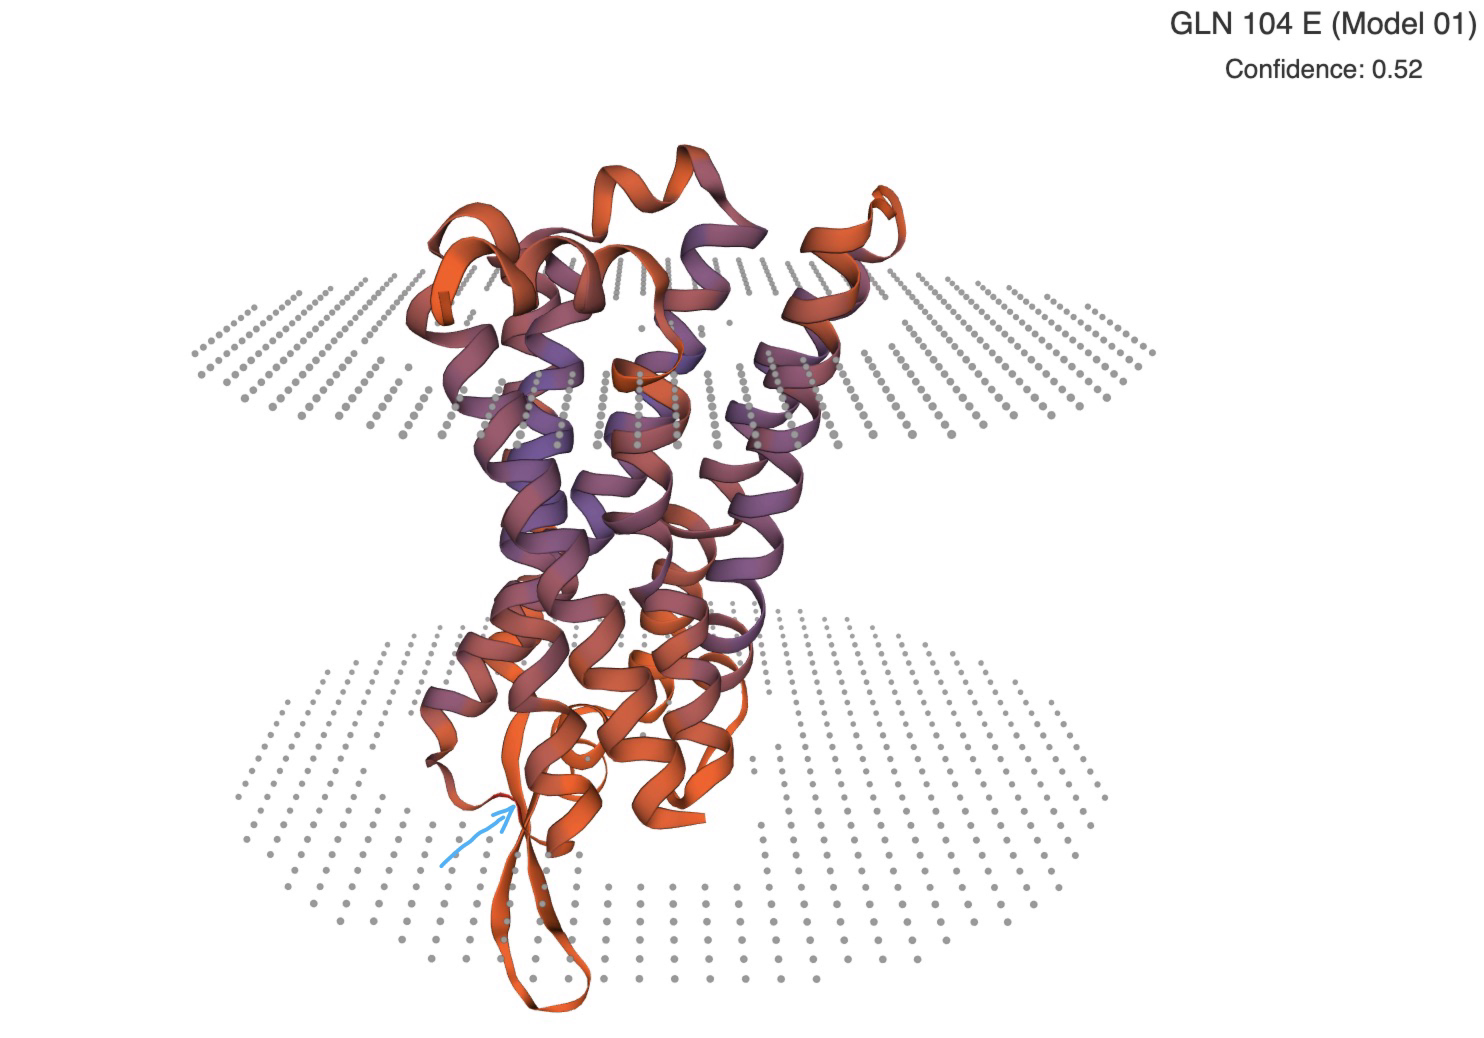
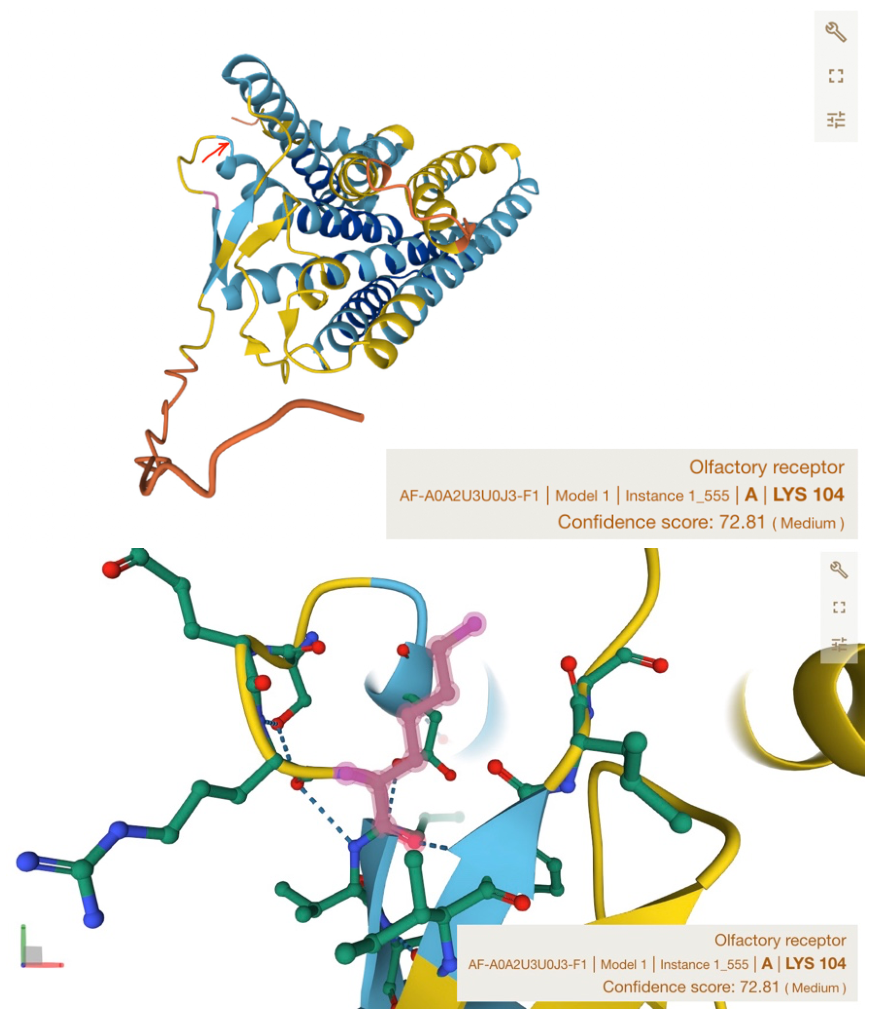
  • Structural comparison: Combined the AlphaFold wild-type structure with a SWISS-MODEL variant-sequence model, located amino acid 104, and compared its local position and model confidence to produce structural visualizations and an analysis report.

BWA-MEM, SAMtools, BCFtools, VEP, GRCh38, dbSNP, UniProt, AlphaFold, SWISS-MODEL

OR4F5 K104Q variant structural model and residue 104
The OR4F5 K104Q variant model marks residue 104 and shows the overall transmembrane-protein conformation and model scores.

CRISPR/Cas9 functional study of painted lady butterfly wing morphology

2021-09 – 2021-12Georgia Tech · Undergraduate genetics honors laboratory project

Wet labData visualization

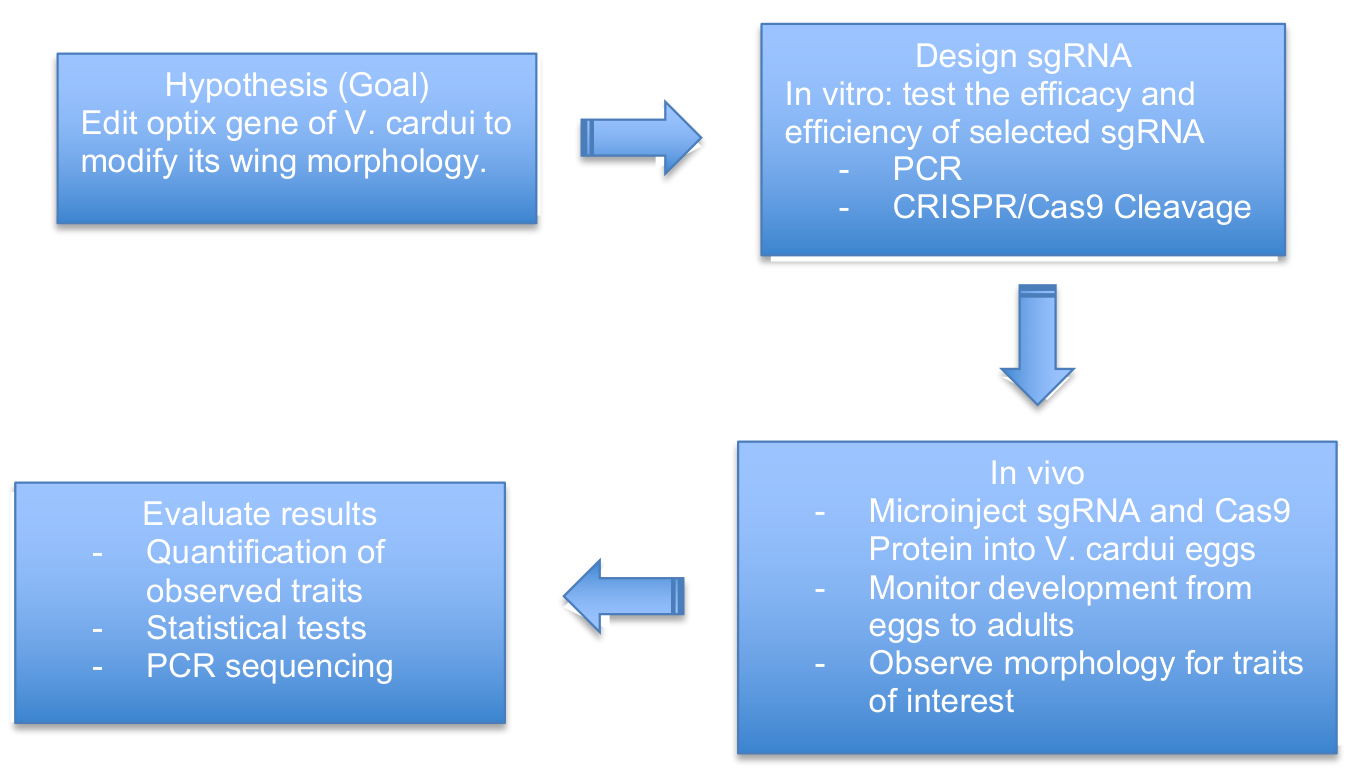
Designed CRISPR/Cas9 knockout experiments targeting candidate genes such as optix to test for changes in wing color and eyespots, investigating how genes contribute to morphology.

Work and methods: CRISPR/Cas9 functional study of painted lady butterfly wing morphology
  • Target selection and in vitro checks: Used BLAST, CHOPCHOP, and Primer-BLAST to analyze candidate genes, sgRNAs, and primers. Performed PCR and in vitro Cas9 checks, examining experimental products using an approximately 503 bp optix amplicon and 2% agarose gels.
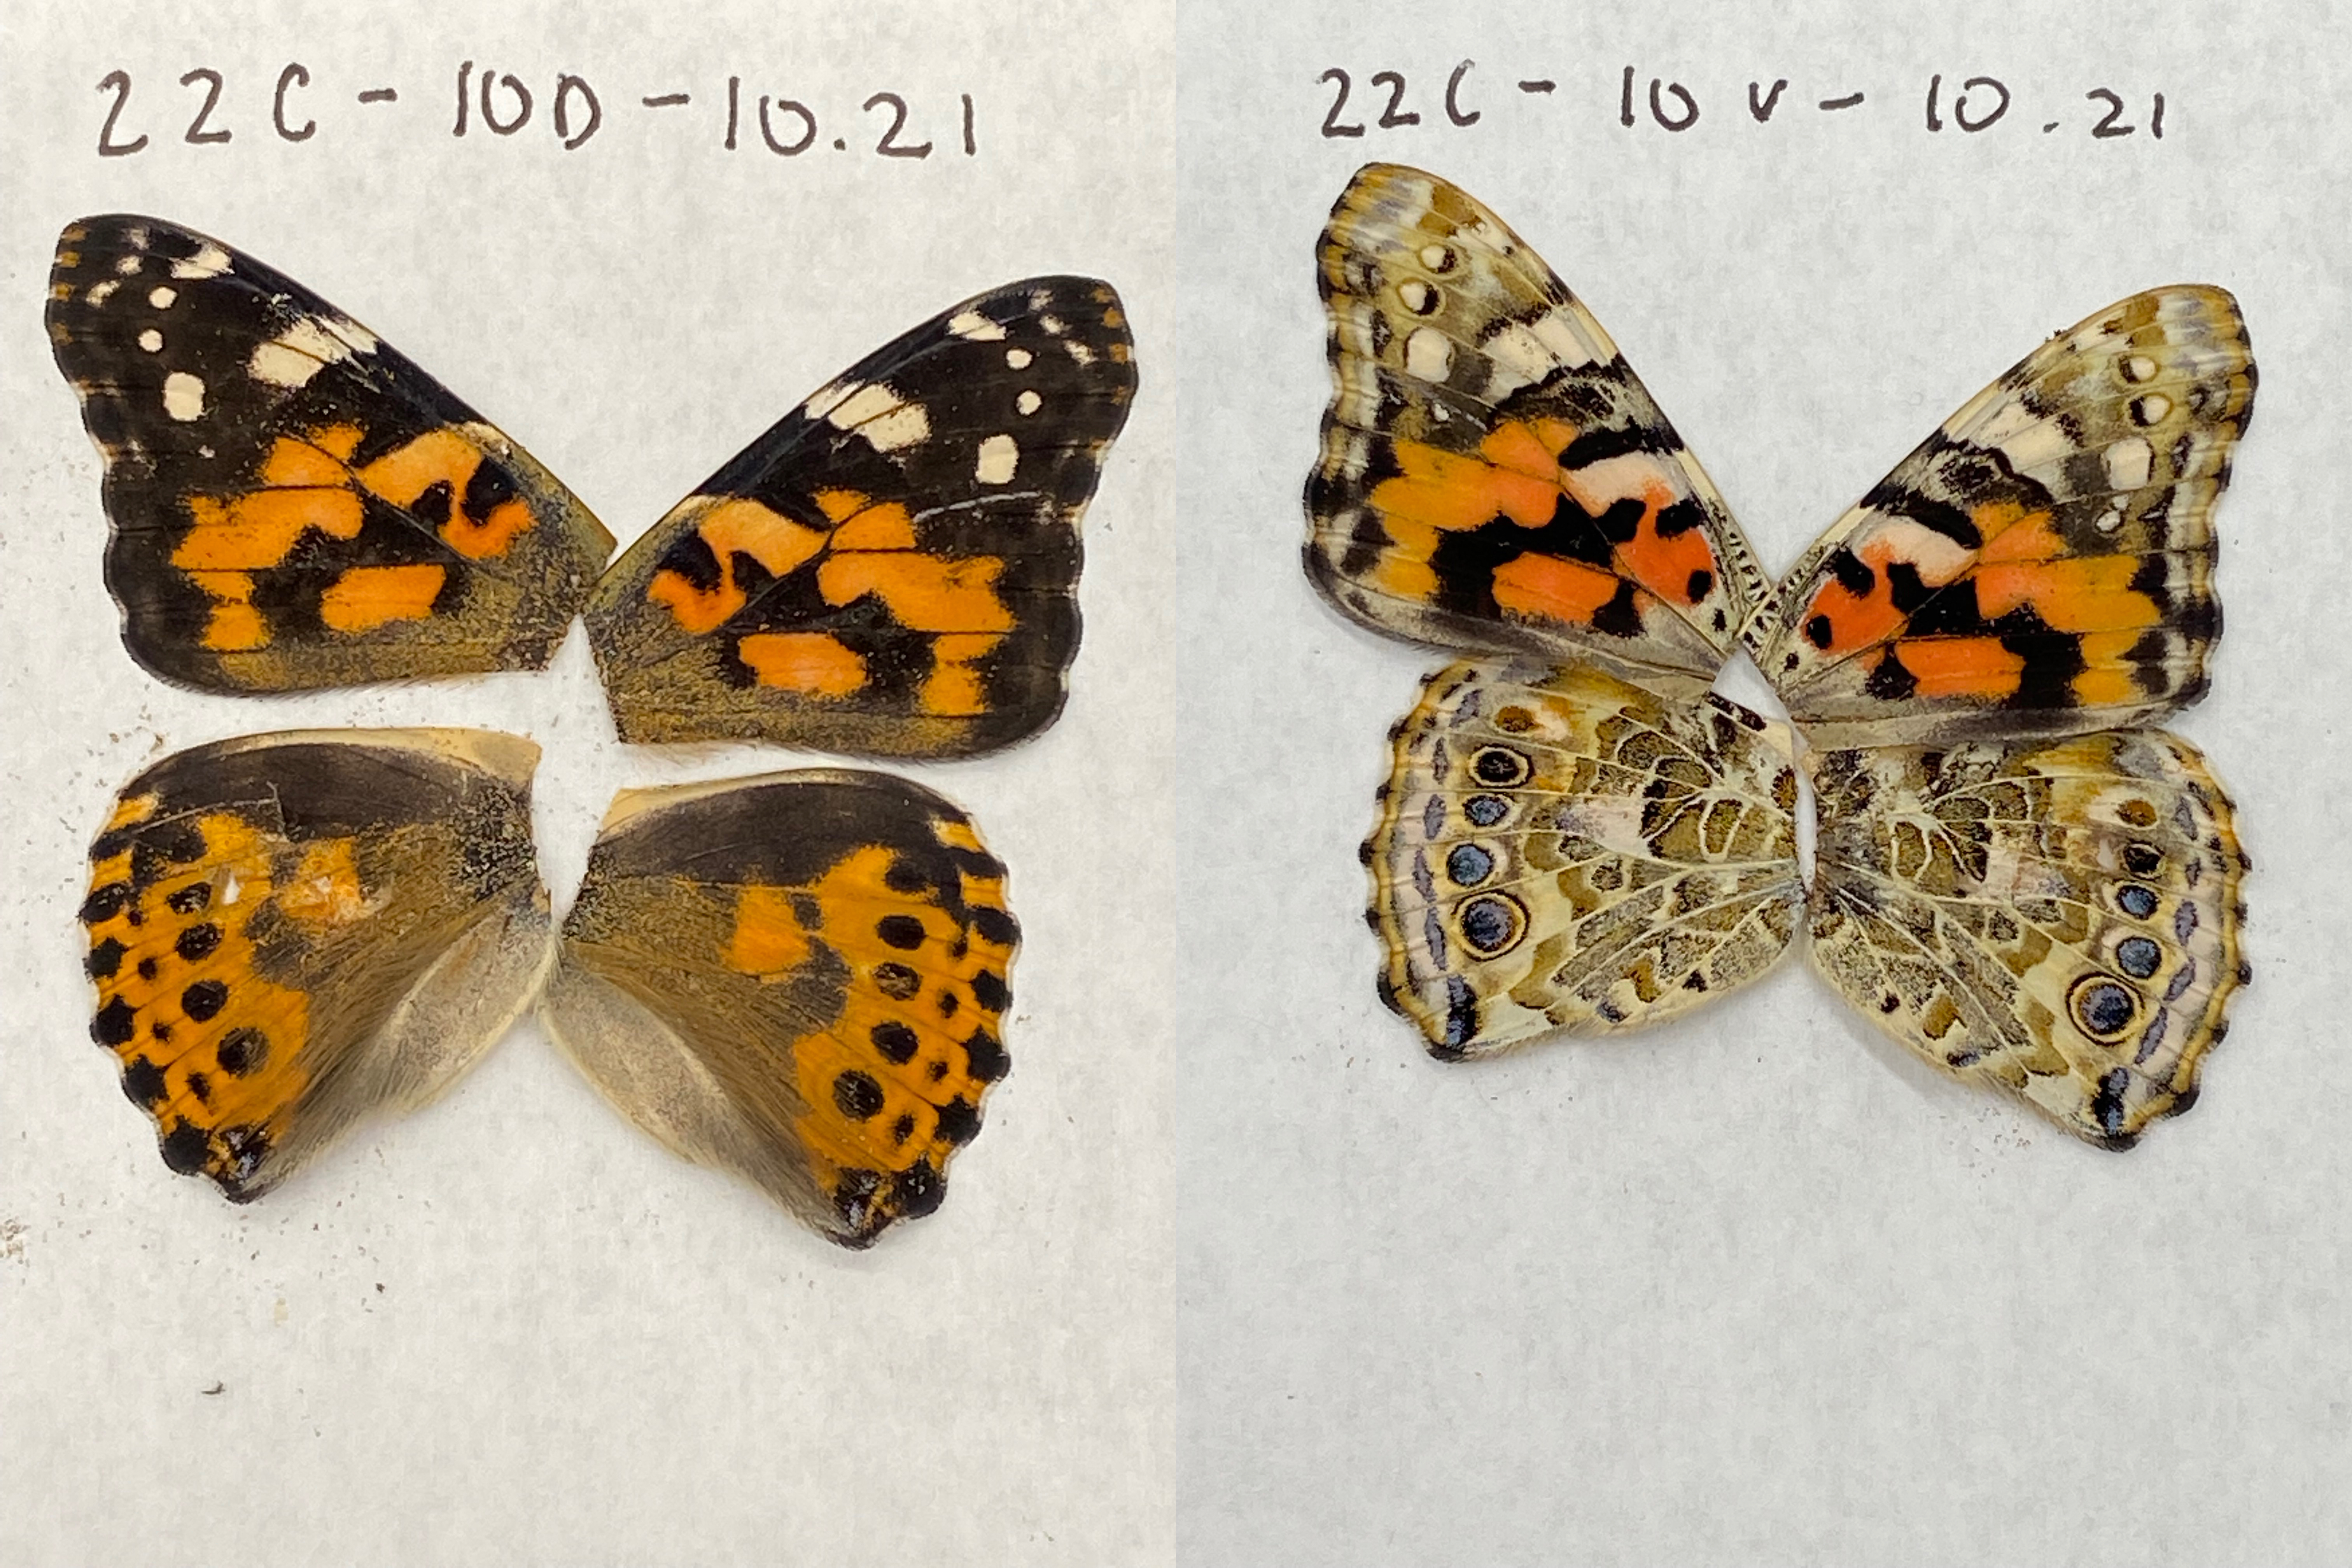
  • Injection and phenotype records: Participated in embryo microinjection and developmental tracking. Archived adults by group, injection date, and individual identifier, arranged four wings consistently, photographed dorsal and ventral sides, and recorded color, symmetry, and eyespot features.
  • Quantification and statistics: Used ImageJ to measure wing ROIs and black-area fractions, and R to analyze 241 observations aggregated by the class. Compared treatment and wild-type groups, using ventral eyespot observations to discuss the interpretive scope of a single area metric.

CRISPR/Cas9, BLAST, CHOPCHOP, Primer-BLAST, PCR, electrophoresis, microinjection, ImageJ, R

Dorsal (left) and ventral (right) wing patterns of butterfly specimen 22C
The dorsal view on the left shows orange and black markings and wing veins; the ventral view on the right shows eyespots, color bands, and fine patterns, presenting both sides of specimen 22C together.